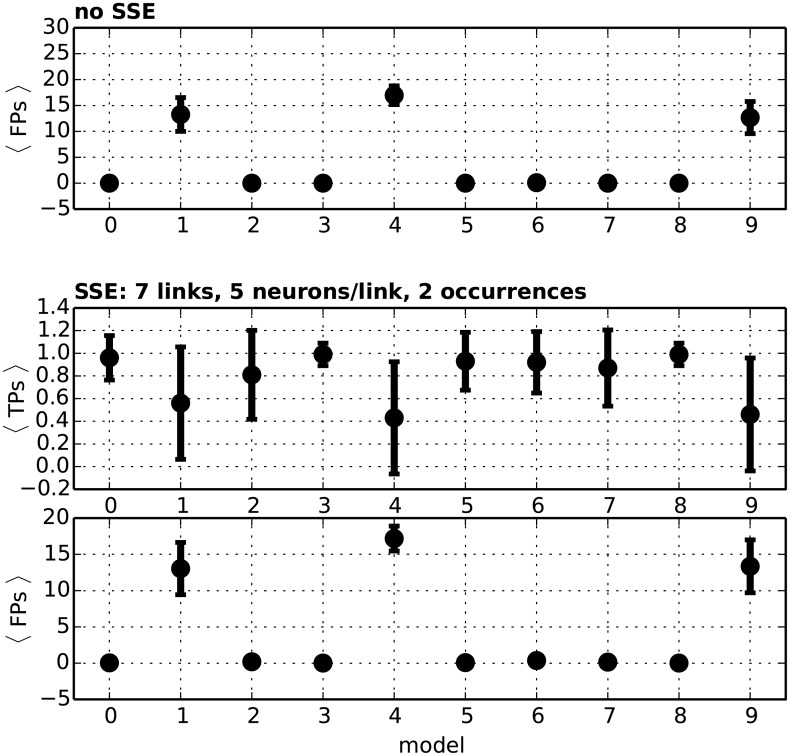
Fig 12. Performance of the Monte-Carlo approach.
Top panel: Average number of FPs (vertical axis) found over 100 simulations of each model from 0 to 9 (horizontal axis) using the Monte-Carlo estimate of the joint probability matrix under . Middle panel: Average number of TPs found for each model from 0 to 9 after injecting two repetitions of an SSE (equivalent to one DS in the intersection matrix) with 7 events and 5 neurons/event. Bottom panel: Average number of FPs for the same data as in the middle panel.

