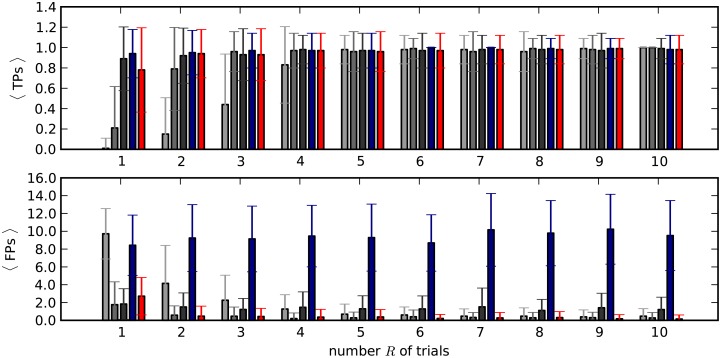
Fig 13. Rate profiles estimated via 3 different methods computed over an increasing number of trials.
Average number of TPs (top) and FPs (bottom) resulting from different firing rate estimation methods, as a function of the number of trials used to estimate the firing rates of individual neurons (horizontal axis). The data are defined by model 4 and enriched with two repetitions of an SSE with lSSE = 7 links and ξSSE = 5 neurons/link. Gray bars: PSTH (dark: 20 ms bin width, medium-dark: 10 ms, light: 5 ms). Blue bars: kernel convolution with fixed kernel width (200 ms). Red bars: optimized-bandwidth kernel convolution.

