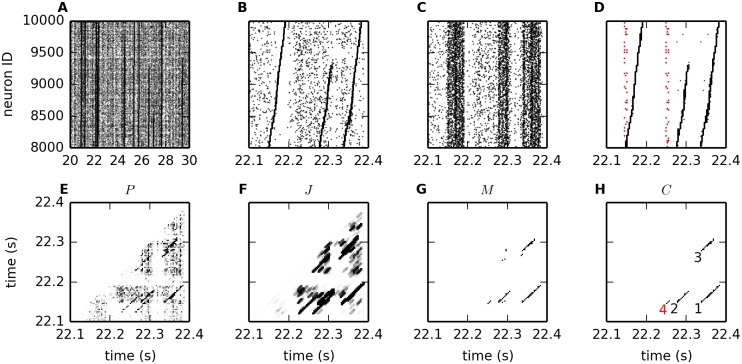
Fig 16. Synfire chain network data and analysis results.
(A-D) Activity of 2000 neurons (numbered 8001 to 10,000) forming the entirety of an active SFC in a balanced random network [12] composed of 20 groups. Neurons 8001 − 8100 form the first group of the chain, neurons 8101 − 8200 the second group and so on. A subset of the neurons also participate in 3 successive groups of a second SFC in the network. (A) Activity over a time window of 10 s (replicated from [12], Fig 2A). (B) Enlargement of (A) showing 300 ms of data (replicated from [12], Fig 2B). The SFC under consideration is activated three times in this time interval. (C) Same as in panel (A), but with random sorting of the neuron IDs on the vertical axis. (D) SSE activity detected by ASSET. In the time interval considered, the two SFCs are stimulated three times (black dots) and two times (red dots), respectively. (E-H) Probability matrix P, joint probability matrix J, masked matrix M and cluster matrix C. Numbers 1 to 3 and 4 in the cluster matrix mark the significant DSs found by ASSET and associated to the activations of the first and second SFCs, respectively.

