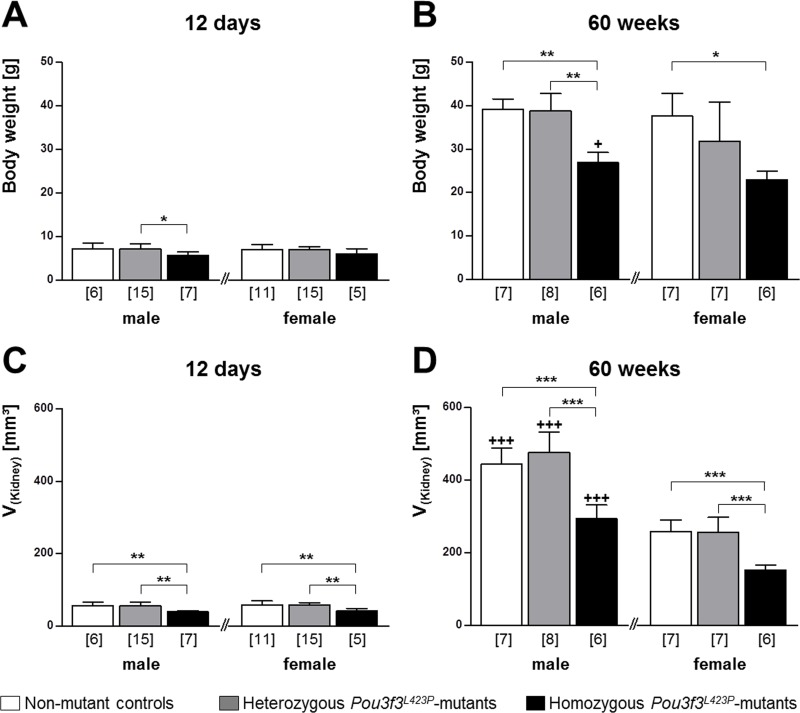
Fig 1.
Body weight (A, B) and volume of the perfusion-fixed right kidney (C, D) of 12-day-old (A, C) and of 60-week-old (B, D) Pou3f3L423P mutant mice and non-mutant control mice. The numbers of animals examined are given in parentheses. Data are means ± SD. Significant differences between homozygous and heterozygous mutants and non-mutant control mice are indicated by asterisks. *: p < 0.05, **: p < 0.01, ***: p < 0.001. Significant differences between male and female mice of identical genotypes are indicated by crosses. +: p < 0.05, ++: p < 0.01, +++: p < 0.001.

