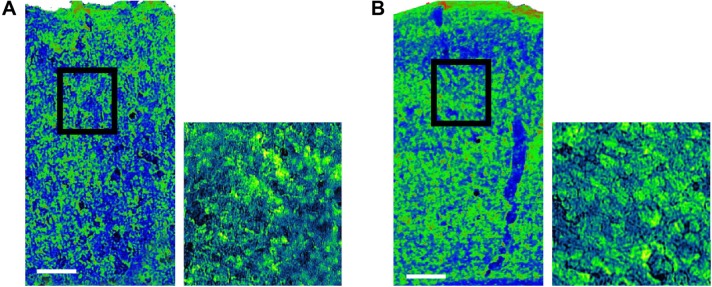
Figure 2.
Pseudocolor image of immunohistochemical demonstration of UCP5 expression in the rat cerebral cortex at 24 hours after NaCl application (A) control and (B) after CSD induction with KCl.
Notes: The signal was higher in the treated cortex compared to the control. Pseudocolor scale: green, high signal; blue, low signal. Magnification ×10 on the right, which are magnified areas represented by the square in the left figures, with ×40 on the left. Bar =0.1 mm.
Abbreviation: CSD, cortical spreading depression.

