
Fig. 13.
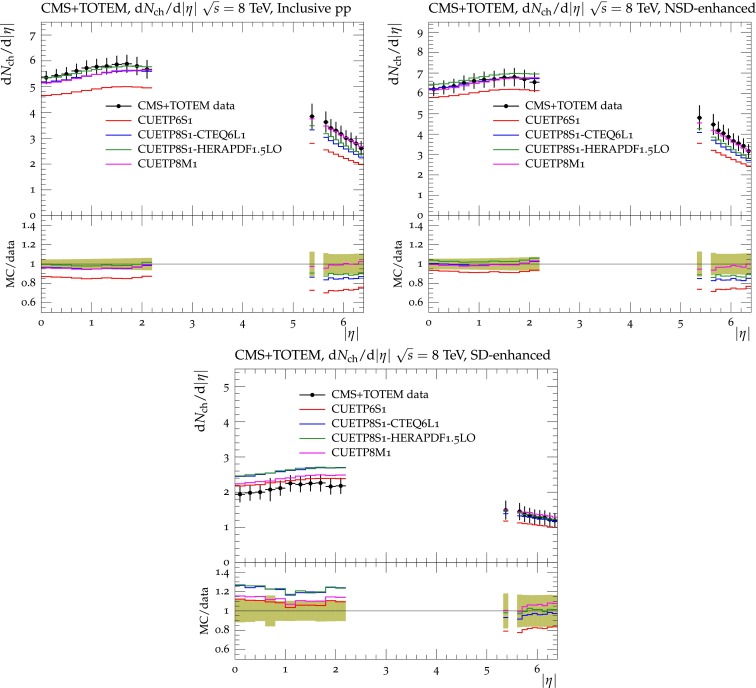
Combined CMS and TOTEM data at [50] for the charged-particle distribution , in inclusive inelastic (top left), NSD-enhanced (top right), and SD-enhanced (bottom) pp collisions. The data are compared to pythia6 using CUETPS-CTEQL1, and to pythia8 using CUETPS-CTEQL1, CUETPS-HERAPDF1.5LO, and CUETPM. The bottom panels of each plot show the ratios of these predictions to the data, and the green bands around unity represent the total experimental uncertainty