
Fig. 16.
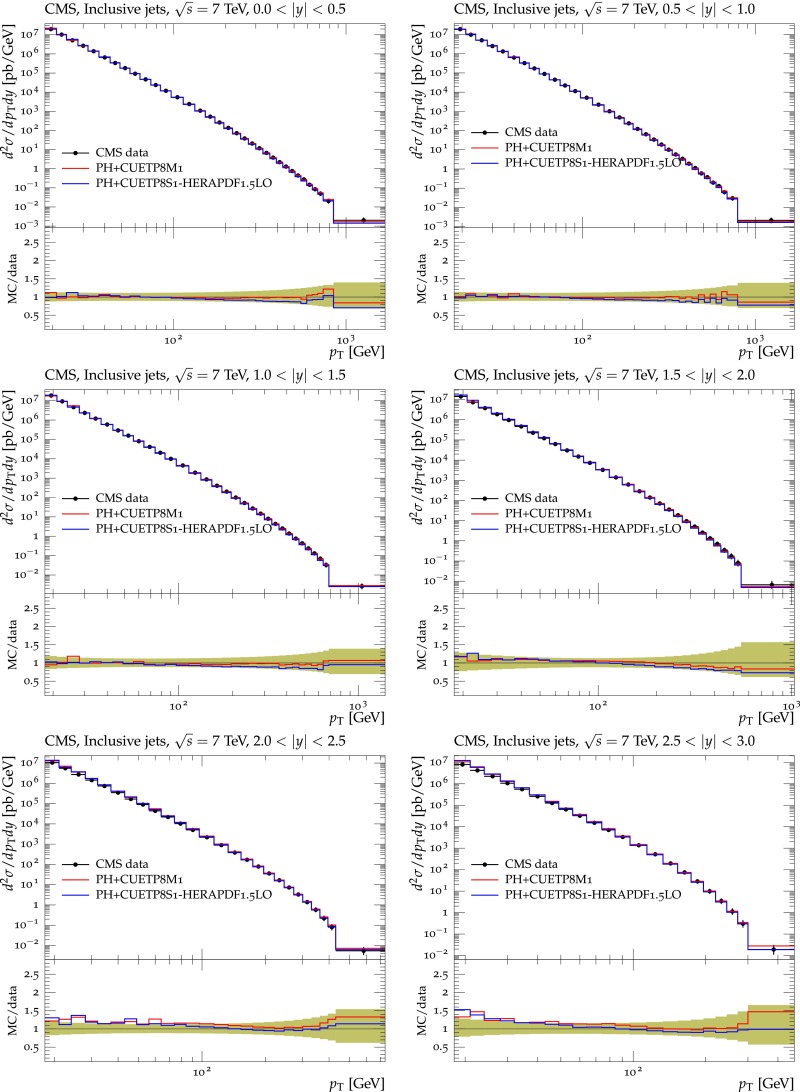
CMS data at [51] for the inclusive jet cross section as a function of in different rapidity ranges compared to predictions of powheg interfaced to pythia8 using CUETPS-HERAPDF1.5LO and CUETPM. The bottom panels of each plot show the ratios of these predictions to the data, and the green bands around unity represent the total experimental uncertainty