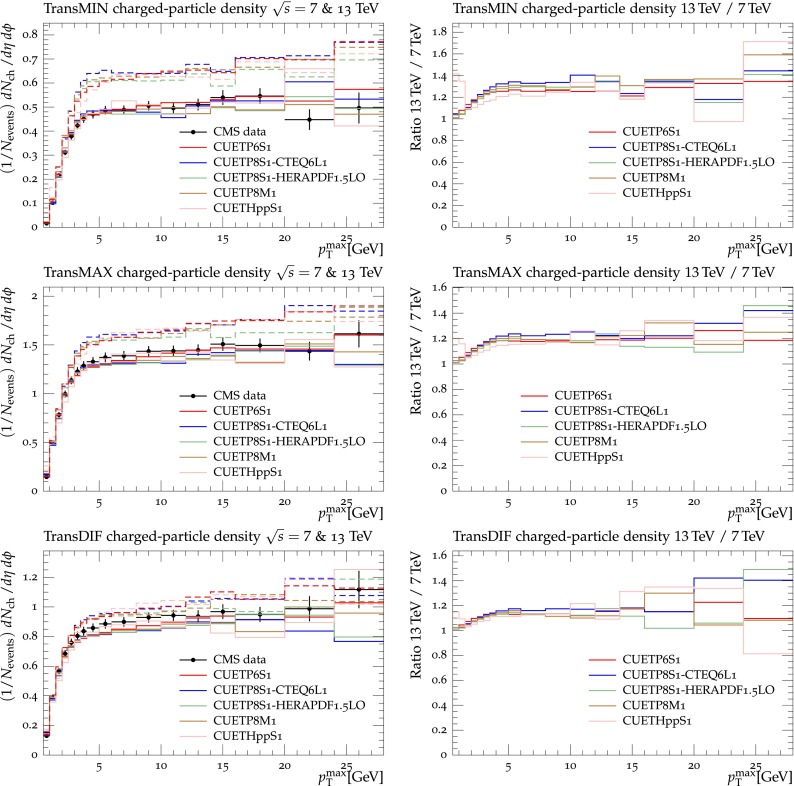
Fig. 20.
Charged-particle density at for particles with and in the TransMIN (top), TransMAX (middle), and TransDIF (bottom) regions, as defined by the leading charged particle, as a function of the leading charged-particle . The data are compared to pythia6 using CUETPS-CTEQL1, to pythia8 using CUETPS-CTEQL1, CUETPS-HERAPDF1.5LO, and CUETPM, and to herwig++ using CUETHppS. Also shown are the predictions (left) based on the CMS UE tunes at (dashed lines), and the ratio of the to results for the five tunes (right)

