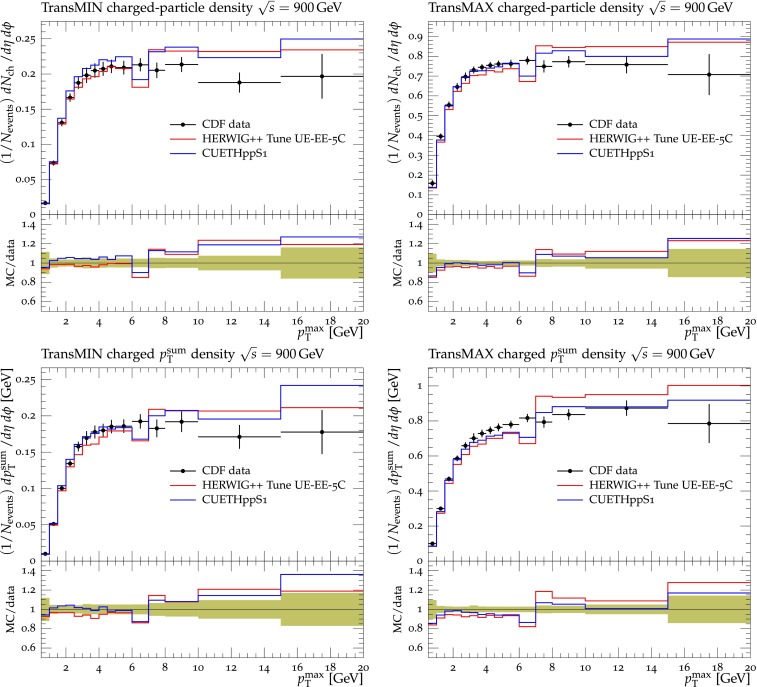
Fig. 28.

CDF data at [11] on particle (top) and densities (bottom) for charged particles with and in the TransMIN (left) and TransMAX (right) regions as defined by the leading charged particle, as a function of the transverse momentum of the leading charged-particle . The data are compared to the herwig++ Tune UE-EE-C and CUETHppS. The green bands in the ratios represent the total experimental uncertainties
