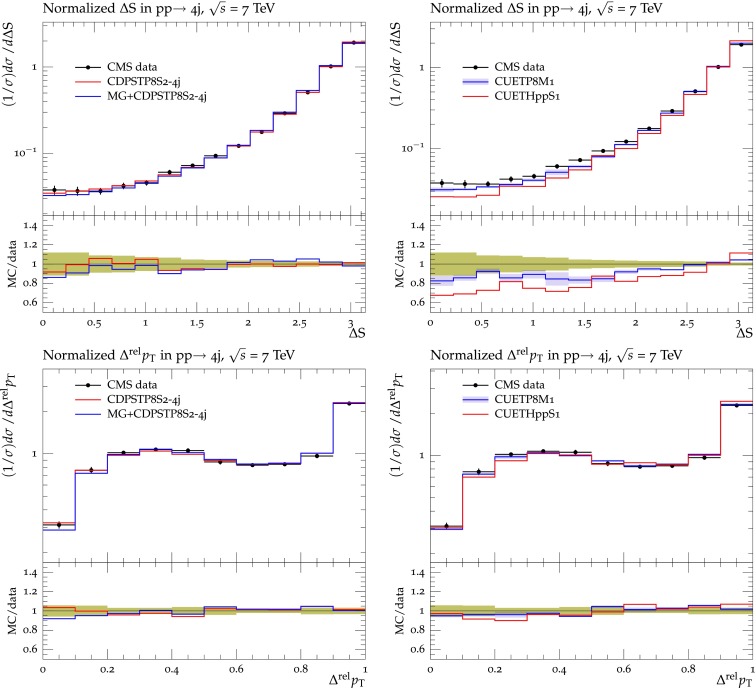
Fig. 8.

Distributions in the correlation observables S (top) and (bottom) measured in four-jet production at [37], compared to predictions of pythia8 using CDPSTPS-j and of MadGraph (MG) interfaced to pythia8 using CDPSTPS-j (left) and pythia8 using CUETPM and herwig++ with CUETHppS (right). Also shown are the ratios of the predictions to the data. Predictions for CUETPM (right) are shown with an error band corresponding to the total uncertainty obtained from the eigentunes (Appendix A). The green bands around unity represent the total experimental uncertainty
