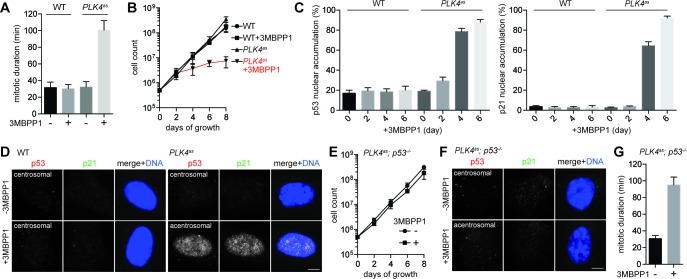
Figure 1. Genome-wide CRISPR-mediated loss-of-function screen for components required for centrosome loss-induced G1 arrest.
(A) Acentrosomal cells exhibits prolonged mitosis. Measurement of mitotic duration of wild type RPE1 and PLK4as cells dividing in the presence or absence of 3MBPP1 with live-cell imaging. With 3MBPP1 treatment, cells gradually lost centrosomes and ceased to proliferate; the duration of acentrosomal mitosis was measured four days after 3MBPP1 addition. Data are means ± SD. n>30, N = 3. (B) Cell proliferation ceases in acentrosomal cells. Growth curve of wild type RPE1 and PLK4as cells with or without 3MBPP1 treatment. Data are means ± SD. n>50, N = 3. (C) p53 and p21 accumulate in the nucleus of acentrosomal cells. Quantification of p53 (left) and p21 (right) nuclear accumulation in wild type RPE1 and PLK4as cells after 3MBPP1 addition. Data are means ± SD. n>100, N = 3. (D) Representative immunofluorescence images of cells in (C) on day 6 stained with antibodies against p53 and p21. Scale bar, 5 μm. (E) Acentrosomal cells continue to proliferate when p53 is removed. The growth curve of PLK4as; p53-/- cells following 3MBPP1 addition. Refer to (B) for growth curves of PLK4ascells. Data are means ± SD. n>50, N = 3. (F) p21 does not accumulate in PLK4as; p53-/- cells during acentrosomal cell division. Immunofluorescence images of cells stained with the antibodies indicated. Scale bar, 5 μm. (G) PLK4as; p53-/- cells divide by prolonged mitosis in the absence of the centrosome. Graph showing mitotic duration of centrosomal and acentrosomal PLK4as; p53-/- cells measured with live-cell imaging. Data are means ± SD. n>30, N = 3.
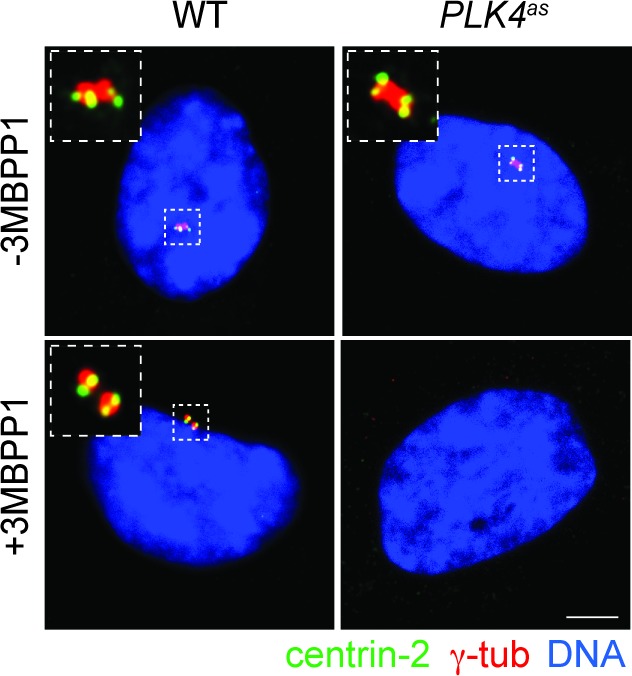
Figure 1—figure supplement 1. Centrosome loss upon PLK4 inactivation.


