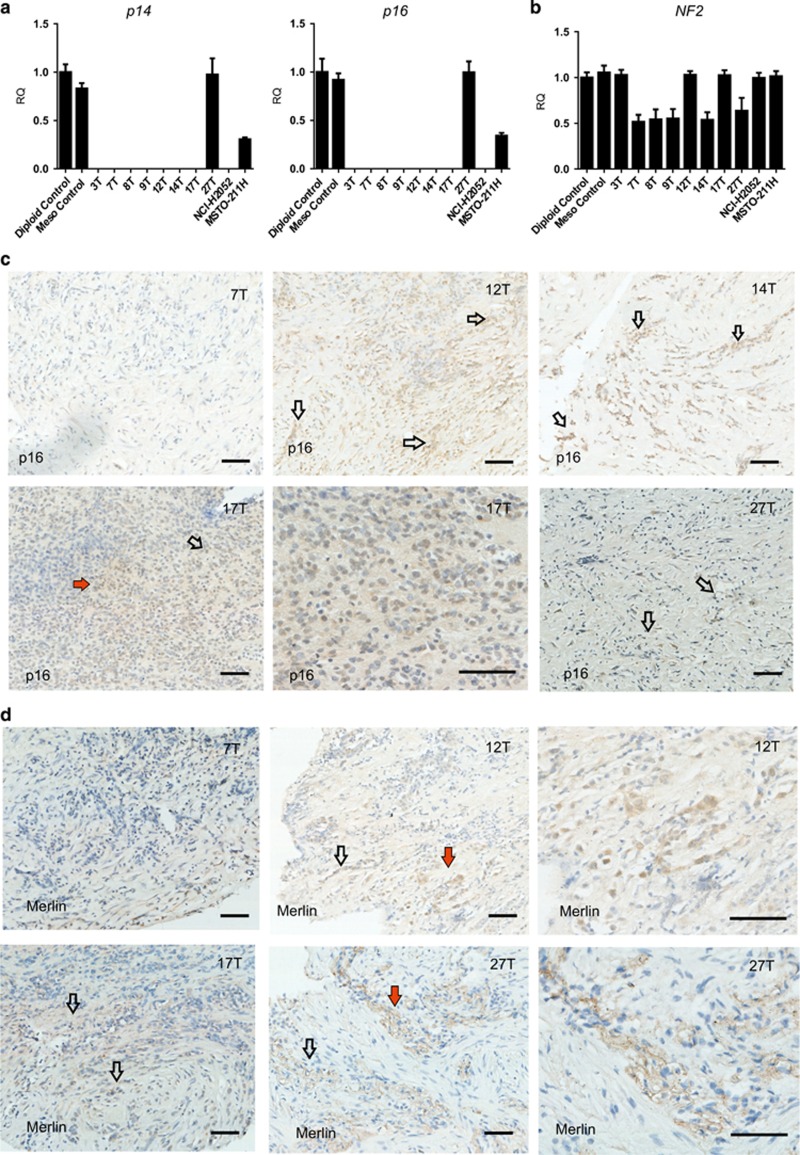
Figure 4.
(a–d) Tumor suppressor genes and proteins in primary and commercial cell lines. (a) Relative quantification of p16INK4A/p14ARF and NF2 copy number by qPCR in mesothelioma cell lines showing homozygous deletion of p16INK4A/p14ARF in seven out of eight patient-derived cell lines and in NCI-H2052, but not in MSTO-211H. The graphs show relative quantification of each locus (mean of 2−ΔΔCT). (b) Relative quantification of NF2 copy number by qPCR showing heterozygous deletion of NF2 in MESO-7T, MESO-8T, MESO-9T, MESO-14T and MESO-27T, but not in MESO-3T, MESO-12T, MESO-17T and in the commercial lines NCI-H2052 and MSTO-211H. The graph shows relative quantification of NF2 copy number (mean of 2−ΔΔCT). (c) FFPE sections of the patient tumors stained for p16; positively stained areas are marked by arrows, the areas marked by red arrows are shown at higher magnification. Scale bar indicate 20 μm. (d) FFPE sections of the patient tumors stained for NF2 product Merlin; positively stained areas are marked by arrows, the areas marked by red arrows are shown at higher magnification. Scale bar indicates 20 μm

