Figure 5.
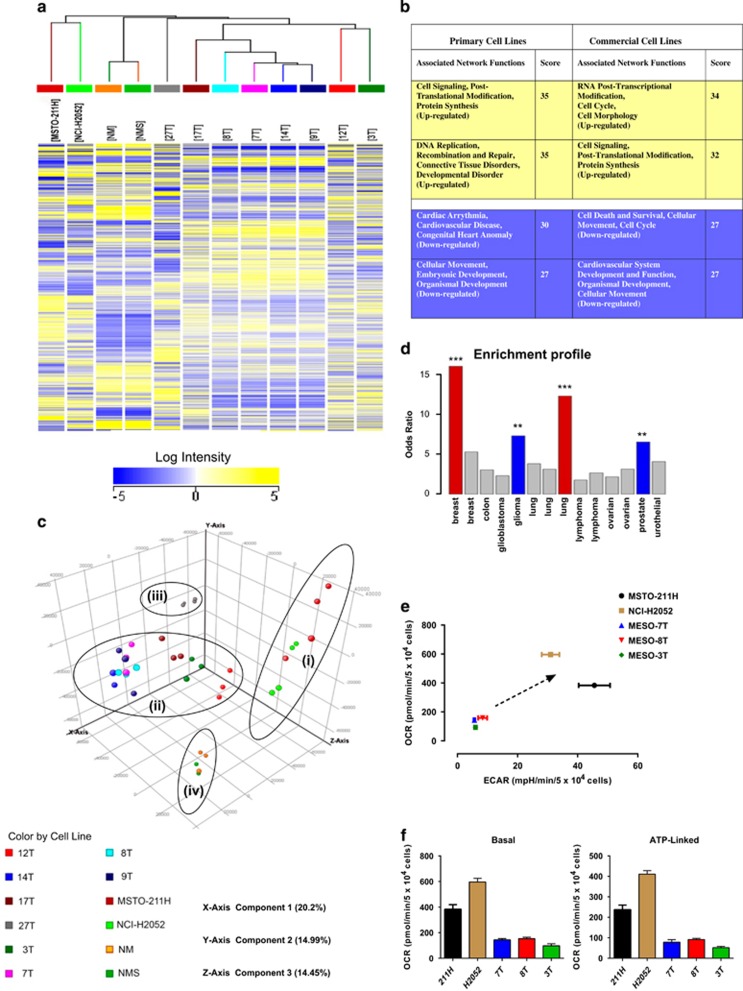
(a) Gene expression pattern and hierarchical clustering of control (NM - cells from a single donor and NMS - pool from four donors), commercial (MSTO-211H, NCI-H2052) and primary mesothelioma cell lines (3T, 7T, 8T, 9T, 12T, 14T, 17T, 27T). RNA was extracted from at least three independent cultures for each cell line. The heat-map displays the expression level of the most variable transcripts across the samples (fold change >2 compared with NM control). The legend bar shows the color code for the normalized log intensity values. Two-dimensional hierarchical clustering was performed using the average linkage-clustering method. Relationships among the cell lines are represented by a binary tree (dendrogram). The vertical position of the split gives the distance (dissimilarity) between the tested cell lines. (b) Top networks in the transcriptome. Significantly highly represented networks were identified. Networks that were significantly highly represented (P≤10−10; Fischer's exact test) were identified from the gene list, with significant difference (ANOVA) compared with normal mesothelial cells, using Ingenuity Pathway Analysis software (Ingenuity Systems, Redwood City, CA, USA). The network score describes the probability (P=10-network score) that the molecules in the network are associated with the data set by chance alone. Networks with a score of +30 were viewed as highly significant (10=minimum score). (c) 3D plot of the scores from Principal Component Analysis. Four separate groups corresponding to the hierarchical clustering results were highlighted by circles (i-commercial cell lines, ii- seven primary cell lines, iii- MESO-27T cell line and iv-normal primary mesothelial cells) and present a strong correlation of signals (d), Enrichment profile across 15 data sets (the best hit for each data set is plotted) showing high similarity (***) of MM primary cell lines to lung and breast cancer (odds ratio>10) and similarity (**) to glioma and prostate cancer (odds ratio>5) in terms of aberrantly expressed genes. (e) Metabolic upregulation of commercial compared with primary cell lines. To assess the difference in metabolism between primary and commercial mesothelioma lines, 5 × 10⁴ cells were seeded in XF24 microplates 24 h prior to real time measurements of oxidative phosphorylation (OCR) and extracellular acidification rate (ECAR) as described in Materials and Methods. Basal values of OCR and ECAR were calculated from mean values generated from three independent experiments normalized to 5 × 10⁴ cells. Data points show mean±S.E.M., n=3. Increased metabolism is depicted as a shift highlighted by the arrow. (f) Basal and ATP-linked OCR mean values were calculated from three independent experiments normalized to 5 × 10⁴ cells. Bars show mean±S.E.M., n=3

