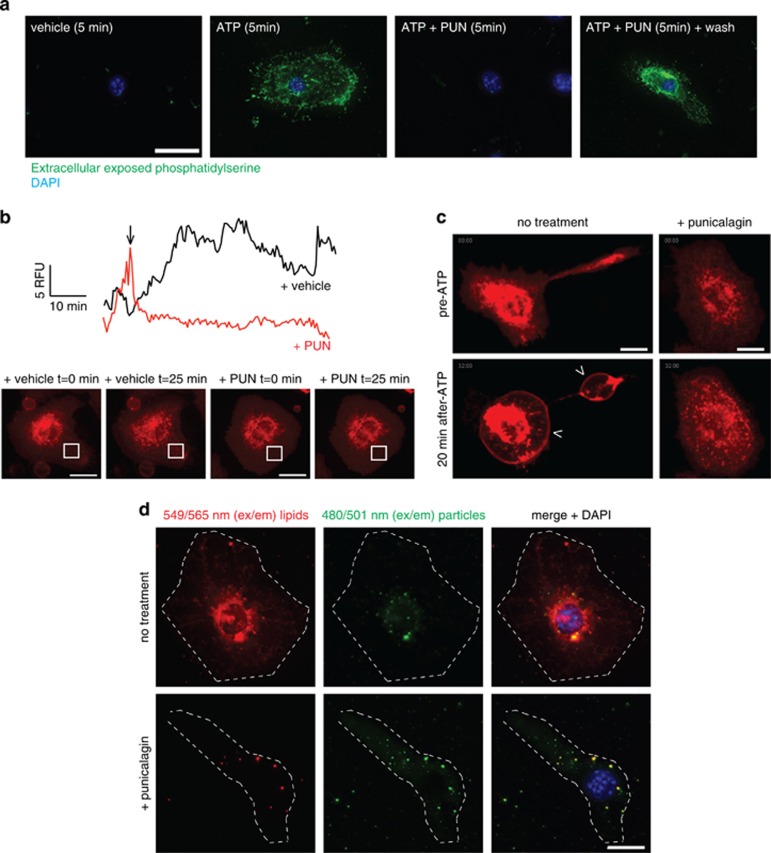
Figure 7.
Punicalagin stabilises plasma membrane lipids. (a) Deconvolved maximum projection fluorescence images of representative BMDMs primed with LPS (1 μg/ml, 4 h), followed by no stimulation (vehicle) or stimulation with ATP (3 mM) for 5 min in the absence or presence of punicalagin (PUN, 25 μm) and then labelled with FITC-annexin V. Nuclei stained with DAPI (blue); scale bar represents 20 μm. (b) Mean of relative fluorescence unit (RFU) quantification in different regions of interest of the plasma membrane, as indicated in the images inserted, of macrophages primed with LPS as in (a) and then labelled with cholera toxin B-Alexa fluor 647 (CTB), untreated (vehicle, black trace), or treated with punicalagin (PUN, 25 μm, red trace) from the time indicated with an arrow. Movements of stained cholesterol-rich patches with CTB results in variations of RFU on the selected ROI, and punicalagin prevented these movements; see Supplementary Movies 6 and 7. (c) Deconvolved images of representative BMDMs stimulated as in (a), but with 5 mM of ATP and stained with CTB; shown are images of CTB fluorescence for time 0 (pre-ATP) and 20 min after ATP application; see Supplementary Movies 8 and 9. Scale bar represents 10 μm. (d) Deconvolved maximum projection fluorescence images of representative BMDMs primed with LPS as in (a) and incubated for 2 h with the Fuse-It liposomes in the absence or presence of punicalagin. Cells are visualised with red-labelled membranes, green-labelled cell lumen, and nuclei counterstained with DAPI (blue). Scale bar represents 10 μm, cellular edges are shown with a white dotted line

