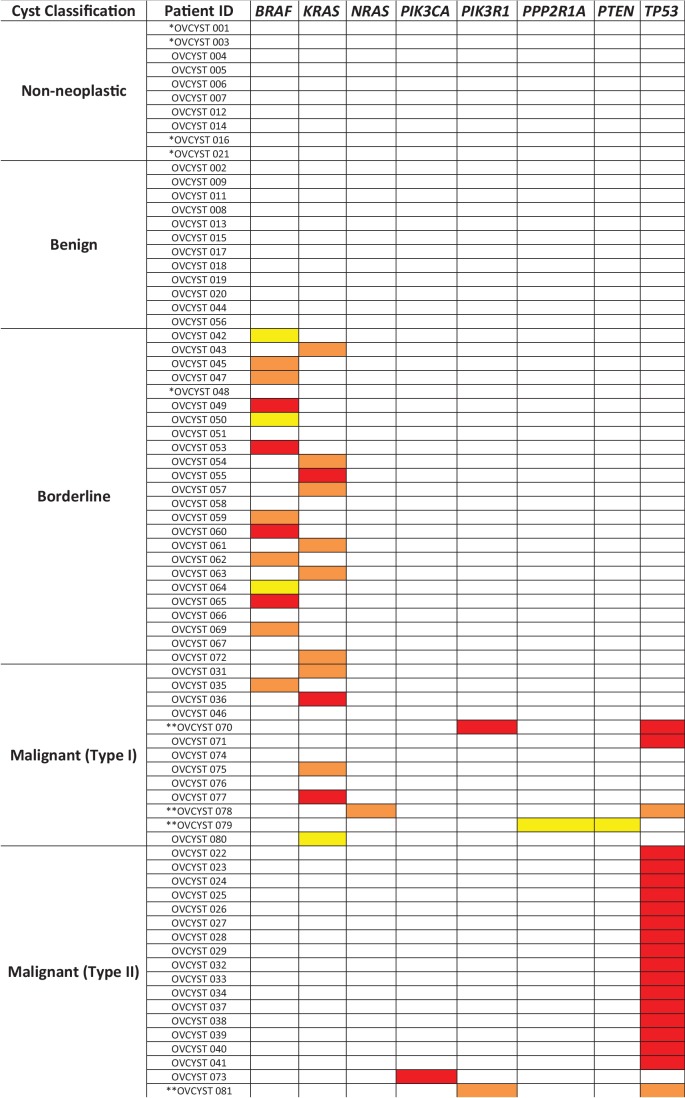
Figure 3. Mutated genes found in the cyst fluid samples.
Yellow boxes represent mutations with mutant allele frequency (MAF) between 0.1% and 1%; orange boxes represent mutations with MAF between 1 and 10%; red boxes represent mutations with MAF greater than 10% (* indicates patients with insufficient DNA for analysis; ** indicates patients with two detected mutations).

