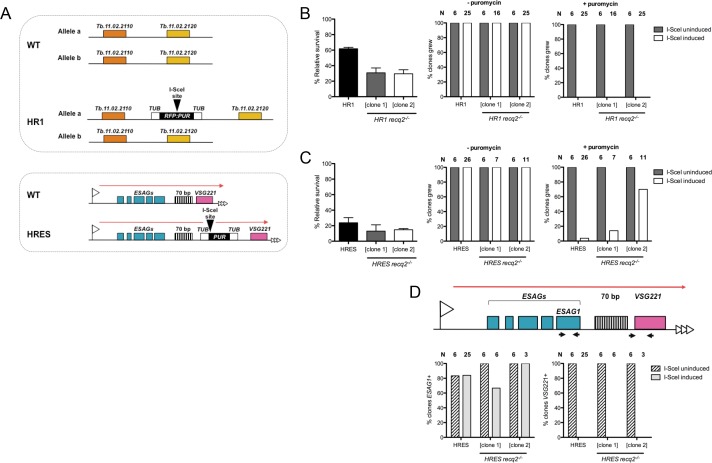
Figure 3. Mutation of TbRECQ2 impairs survival of T. brucei after induction of a DNA double strand break, either in the active telomeric VSG expression site or in the core of a chromosome.
(A) I-SceI target sequences in HR1 and HRES cells. HR1 cells contain an I-SceI recognition site embedded within an RFP:PUR fusion gene (black), flanked by tubulin sequences (white), located between genes Tb.11.02.2110 and Tb.11.02.2020 on one copy of chromosome 11; HRES cells contain an I-SceI recognition site upstream of a PUR gene, flanked by tubulin sequences, located downstream of the 70 bp repeats of the active VSG221 expression site on chromosome 6. B and C show clonal survival following I-SceI induction in HR1 and HRES cells, respectively. In both cases, wild type and two recq2-/- clones were distributed in three 96 well plates at a concentration of 0.26 cells per well either in the absence (I-SceI uninduced) or presence (I-SceI induced) of 2 μg.mL-1 tetracycline. The number of wells with surviving cells after 7–10 days growth is depicted as percentage of survivors following I-SceI induction relative to survivors without I-SceI induction; error bars represent standard error of the mean between three experimental repeats. Puromycin sensitivity of surviving I-SceI induced and uninduced clones was then tested, and is represented as the percentage of tested clones that grew in the presence (+) or absence (-) of 1 μg.mL-1 puromycin (N: number of clones analysed). (D) Clones from (C), excluding those that were puromycin resistant, were assayed for ESAG1 and VSG221 presence by PCR; data are shown as the percentage that were PCR positive (N: number of clones analysed).


