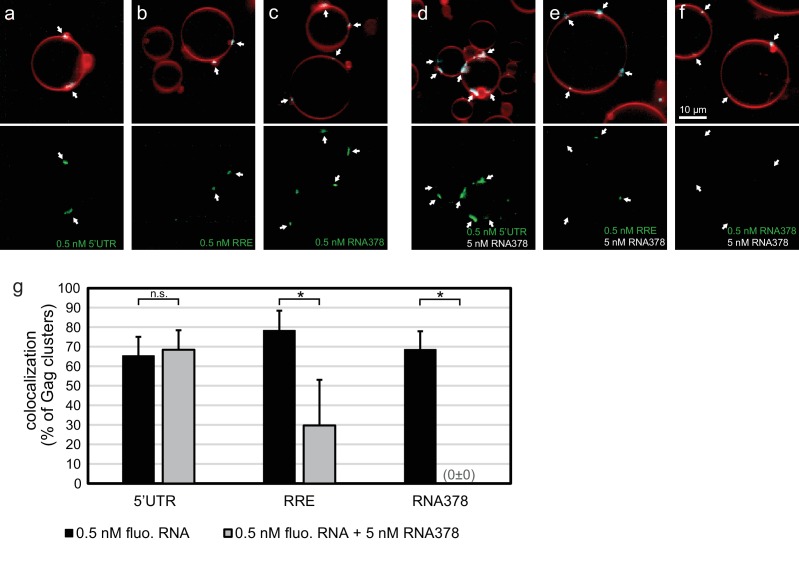
Figure 1. In vitro reconstitution of selective RNA packaging by HIV-1 Gag.
(a) Confocal fluorescence micrograph of GUVs containing 5% PI(4,5)P2. 100 nM HIV-1 Gag-ATTO594 and 0.5 nM HIV-1 5’UTR-Alexa488 were premixed and added to the exterior of the GUVs which were imaged 10 min later. Upper panel, membrane in red and Gag in white/cyan. Lower panel, RNA. (b–c) As (a) but with fluorescent HIV-1 RRE and a 378 nt control ssRNA (RNA378), respectively. (d–f) As (a–c) but with 5 nM non-fluorescent RNA378 added together with the fluorescent RNAs. (a–f) White arrows mark Gag clusters on GUVs, and their position on the corresponding RNA images. Scale bar for all images, 10 µm. (g) Quantitation of fluorescent RNA binding to Gag clusters. Gag clusters on membranes were identified in 10 z-stacks each containing ~10 GUVs, using an unsupervised script which calculated the average RNA fluorescence within the clusters. Gag clusters with an average RNA fluorescence >2.0 times that of the surrounding membrane were counted as positive for colocalization. All measurements were conducted on the same batch of GUVs and error bars indicate standard deviation between three repeats on separate GUV preparations. n.s./*, not significant, and significant, respectively, at p<0.05 level by Student's t-test.


