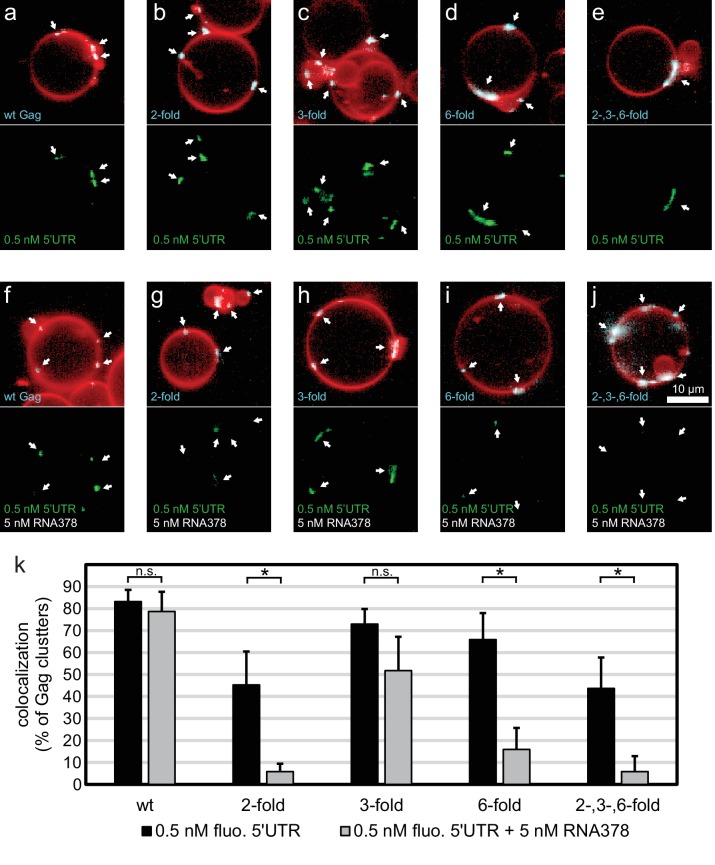
Figure 4. RNA selectivity of CA domain mutants.
(a) Confocal micrograph of GUV, 10 min after adding 100 nM Gag-ATTO594 and 0.5 nM 5’UTR -Alexa488. Upper panel, membrane in red and Gag in white/cyan. Lower panel, RNA. (b–e) As (a) using Gag two-fold, Gag three-fold, Gag six-fold and Gag two-, three-, six-fold, respectively. (f–j) As (a–j) with the addition of 5 nM non-fluorescent RNA378. (a–j) White arrows mark Gag clusters on GUVs, and their position on the corresponding RNA images. Scale bar for all images, 10 µm. (k) Quantitation of RNA binding to Gag clusters, performed as for Figure 1g. n.s./*, not significant, and significant, respectively, at p<0.05 level by Student’s t-test.


