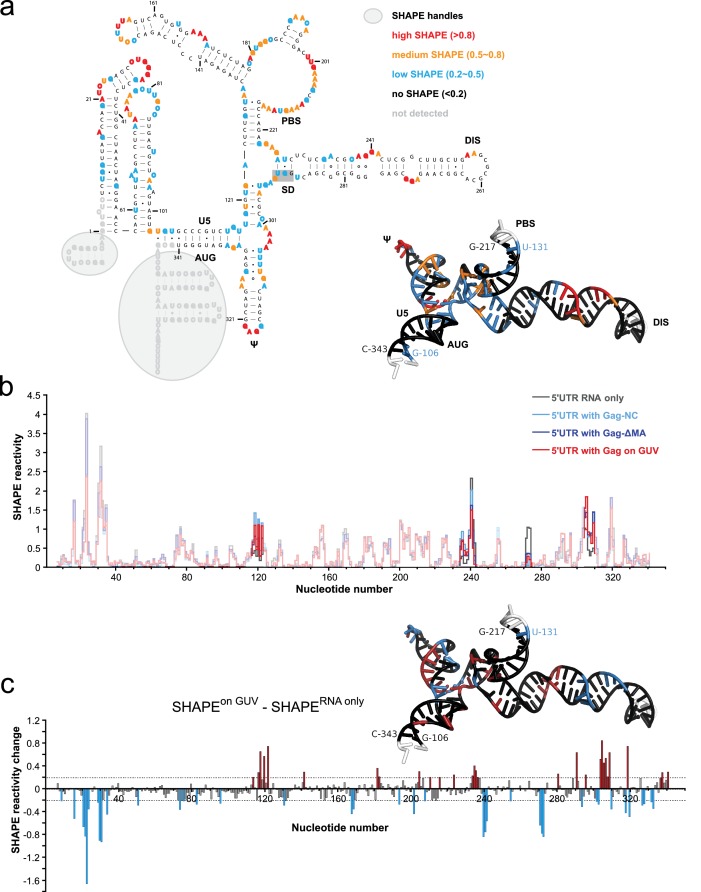
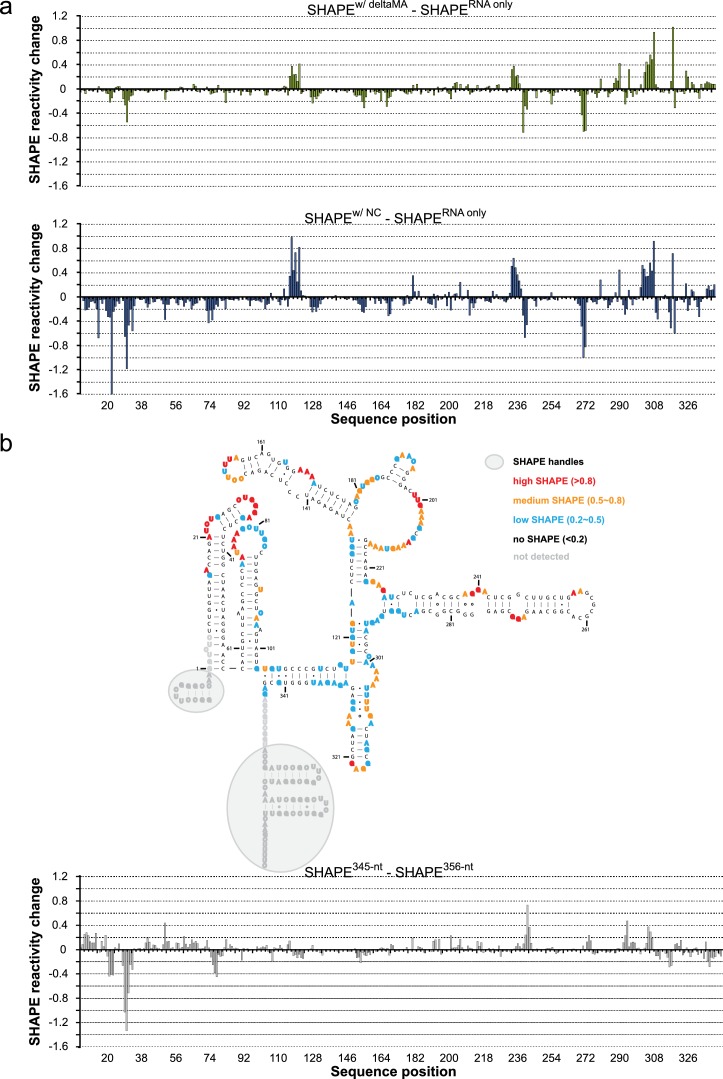
Figure 5. Probing Gag-induced structural changes on the HIV 5’UTR using SHAPE.
(a) Secondary structure of the HIV 5’UTR RNA with SHAPE reactivities labeled. The secondary structure is based on the reported NMR structure (Keane et al., 2015) (PDB 2N1Q). Nucleotides exhibiting high, medium, low, or no SHAPE reactivities are labeled in red, orange, cyan, and black, respectively. SHAPE handles are labeled by gray shadows. The 3D structure colored based on the SHAPE profile using the same color scheme is shown as an insert. U5, U5 region of long terminal repeat. PBS, primer binding site. DIS, dimerization signal. SD, splice donor site. ψ, psi stem loop. AUG, start codon of gag gene. The nucleotides of SD that would be in a loop in the alternative conformation (289–292) are underlined with a gray box. The schematic shows one monomer of the dimerizing 5’UTR. (b) SHAPE profiles of the 5’UTR either alone (in gray) or in complex with the following Gag variants: the NC domain of Gag (in cyan), ΔMA-Gag (in blue), and Gag assembled on GUVs (in red). The regions not showing significant SHAPE changes are masked. (c) SHAPE changes between the 5’UTR alone and the 5’UTR bound by the Gag on GUV. Nucleotides exhibiting reduced or increased SHAPE value upon complex formation are labeled in cyan and dark red, respectively. Corresponding nucleotide are also labeled on the NMR 3D structure model using the same color scheme.


