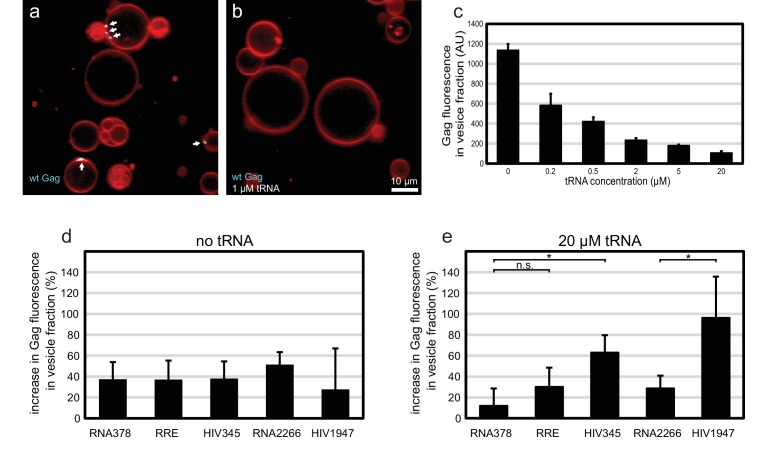
Figure 6. Effect of tRNA and viral RNA on Gag membrane association.
(a) Confocal micrograph of GUVs, 10 min after adding 100 nM Gag-ATTO594. (b) Confocal micrograph of GUVs, 10 min after adding 100 nM Gag-ATTO594, premixed with 1 µM tRNA. (a–b) Membrane in red and Gag in white/cyan. White arrows mark Gag clusters on GUVs. Scale bar, 10 µm. (c) Amount of Gag fluorescence in the vesicle fraction after a vesicle flotation assay with 100 nM Gag-ATTO488, tRNA at 0–20 µm, and 0.4 mg/mg 1.0 µm LUVs. (d) Amount of Gag fluorescence in the vesicle fraction after a vesicle flotation assay with 100 nM Gag-ATTO488 and RNAs at 5 nM. (e) Amount of Gag fluorescence in the vesicle fraction after a vesicle flotation assay with 100 nM Gag-ATTO488, 20 µm tRNA, and other RNAs at 5 nM. (c–e) All measurements shown in the same panel were conducted on the same LUV preparation, with error bars indicating the standard deviation between three repeats conducted on separate LUV preparations. n.s./*, not significant, and significant, respectively, at p<0.05 level by Student's t-test.

