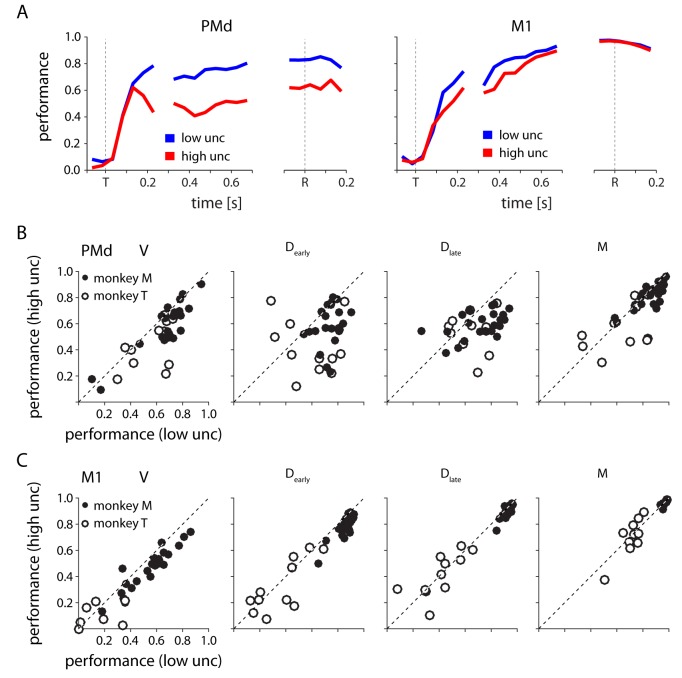
Figure 10. Decoding reach direction from neural activity measured on single trials from PMd and M1, based on PDs computed during center-out (zero-uncertainty) reaches.
(A) The performance of PMd (left) and M1 (right) decoders as a function of time for one example session. Performance is defined as one minus the circular variance of the decoder error. (B) PMd decoder performance in low v. high uncertainty conditions for four 200 ms time windows spanning target appearance to movement in all sessions for both monkeys. Each point represents a single session from monkey M (closed) or monkey T (open) (C) Same as in B, but for M1.

