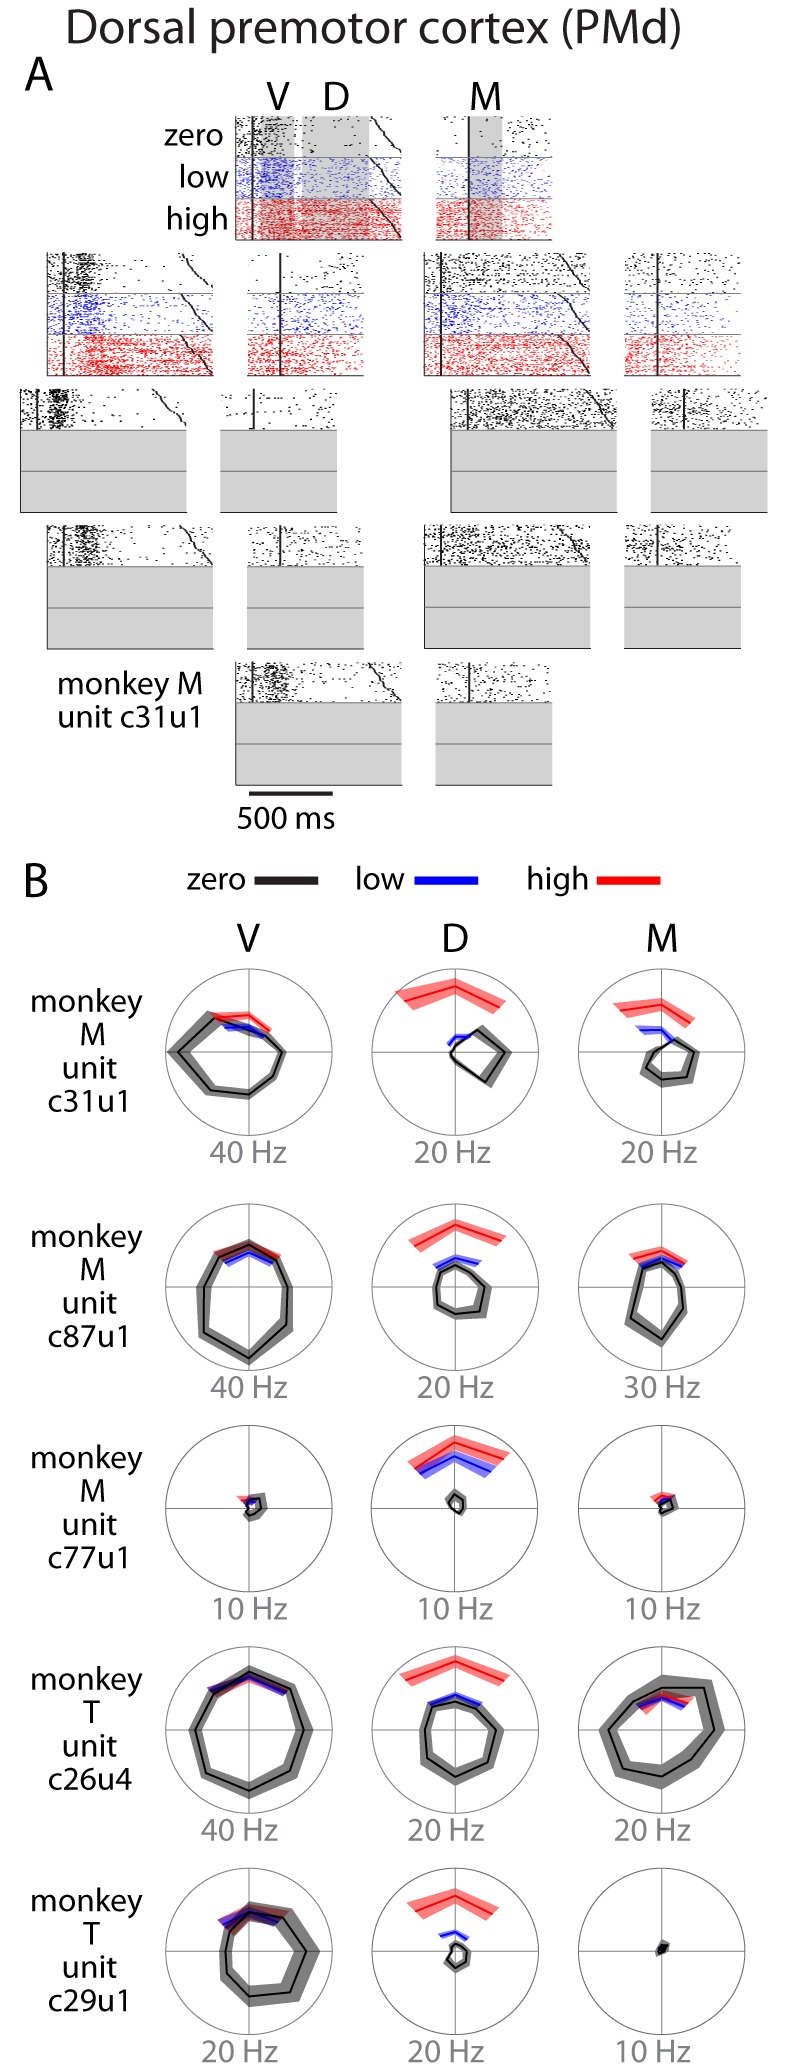
Figure 3. Single unit activity in PMd.

(A) Raster plot for an example neuron. Activity is aligned to either the visual cue appearance (left) or movement onset (right). Colors indicate zero (black), low (blue), and high (red) uncertainty conditions. Dark black points indicate target onset, go cue, and movement onset (B) Directional tuning for other example neurons. Due to the nature of the task, reaches made during uncertain conditions with a non-uniform prior did not span all directions. Many neurons showed an increase in delay (D) or movement (M) activity as a function of uncertainty. Bounds on the tuning plots represent bootstrapped 95% confidence of the mean estimate.
