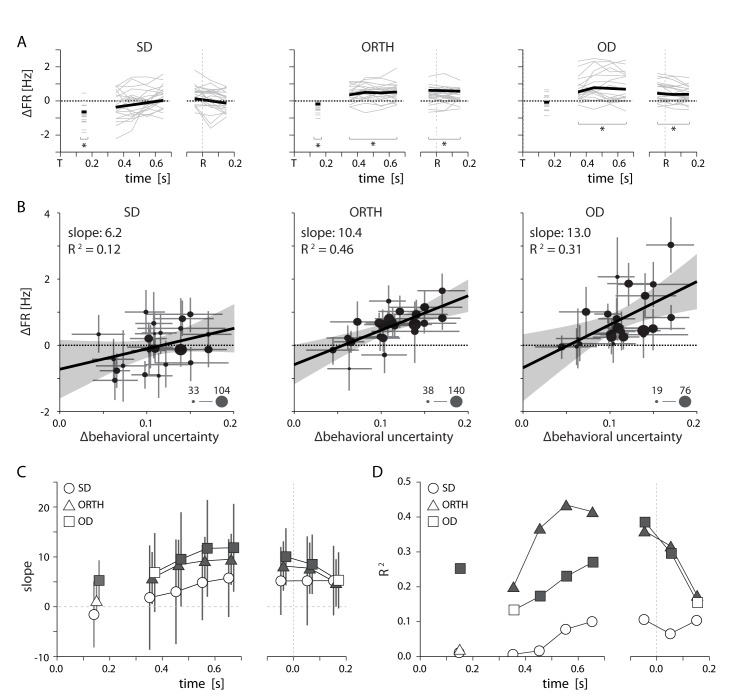
Figure 6. Relationship between PMd activity and behavioral uncertainty.
(A) Thin lines indicate the average difference in firing rate between high and low uncertainty trials for individal sessions. Heavy lines mark the mean across sessions. While SD neurons displayed an average change near zero, activity for ORTH and OD neurons was consistently higher for high uncertainty trials (B) Differences in firing rate between high and low uncertainty conditions as a function of the difference in behavioral uncertainty for a single time window 500–700 ms after target appearance. The correlation was weak for same-direction neurons, but strongly positive for orthogonal- and opposite-direction neurons. Thus, the greater the difference in behavioral uncertainty, the larger the difference in activity for ORTH and OD neurons. Marker size indicates the number of contributing neurons for each session (C) The slopes from B calculated during the visual period (50–250 ms after target appearance; left) and for 100 ms time windows throughout the delay (middle) and movement (right) periods. The larger effect of behavioral uncertainty on OD and ORTH activity compared to SD activity persisted throughout planning and execution. (D) R2 values for the linear fits in C. Filled symbols in C and D represent significant correlations, p<0.05. All error bars represent bootstrapped 95% confidence bounds on the mean estimates.

