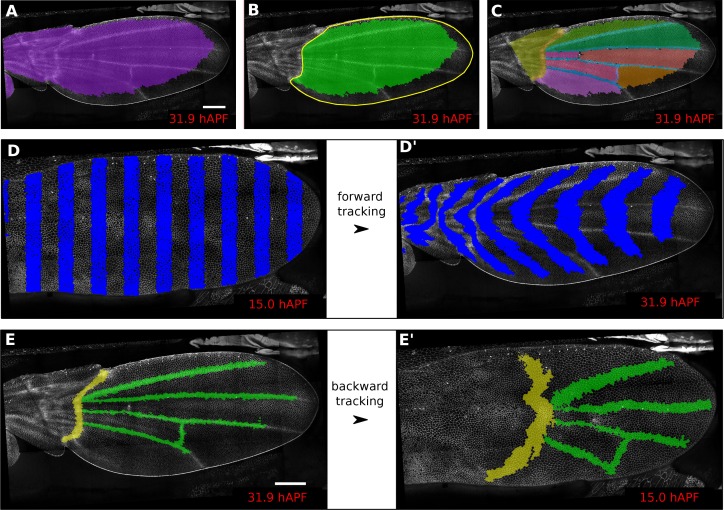
Figure 1. Regions of interest are followed in time by browsing the cell lineages.
(A) Largest population of cells (purple) that remains visible throughout the entire time-lapse. Two cell rows in contact to margin cells were discarded as margin cells are usually not well segmented. (B) Largest blade cell population (green) that remains visible throughout the entire time-lapse. The blade region of interest (yellow line) was defined on the last frame of the time-lapse using a custom Fiji macro (https://github.com/mpicbg-scicomp/tissue_miner/blob/master/fiji_macros/). The underlying cell population was then subset using our lineage browser algorithm. (C) One can define veins and inter-vein regions of interest and apply the same algorithm as in (B). (D–D') Regularly spaced regions of interest automatically selected and followed over time to visualize tissue deformation. (E–E') Here, we make use of the lineage browser routine to trace back the vein positions at 15 hAPF, as they aren't visible yet at 15 hAPF. Scale bar 50 microns.


