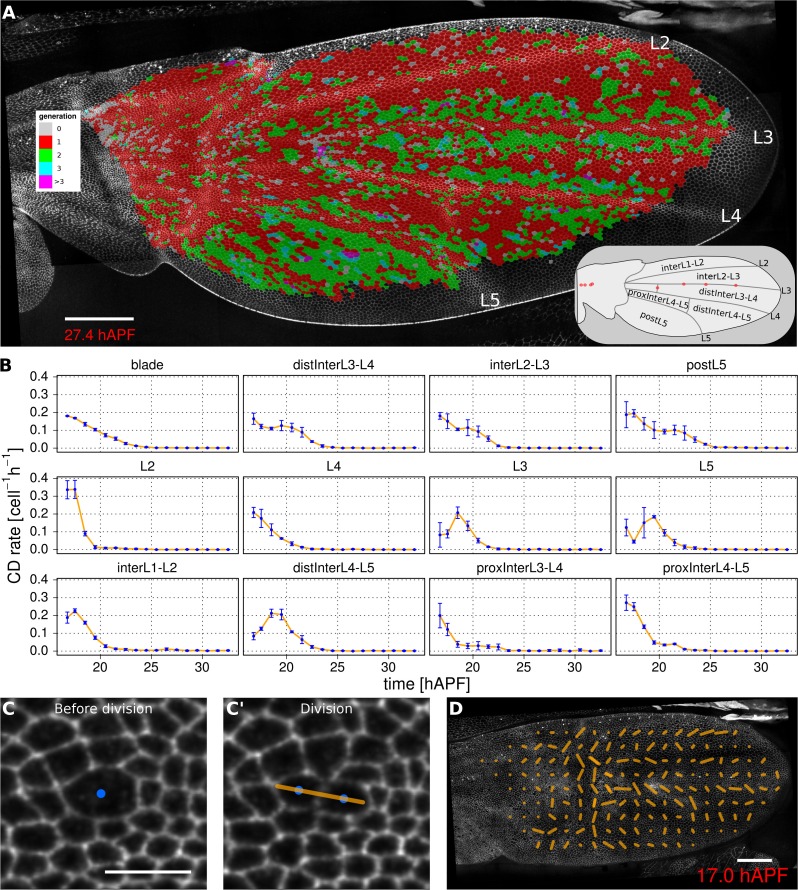
Figure 3. Visualization of cell generations and cell divisions.
(A) Color-coded pattern of cell generations. The wing cartoon on the bottom right shows the names of subregions that we analyze in panel B. Scale bar 50 microns. (B) Cell division rate in different regions of interest. To smooth fluctuations, these rates were averaged in discrete time intervals of one hour (TM R-User Manual, section 3.7). We further averaged these rates amongst the three wild-type wings. Error bars depict the standard deviation between wings. Cells divide earlier in veins L2 and L4 than in L3 and L5. Two maxima corresponding to two rounds of divisions are visible in inter-vein regions: interL2-L3, distInterL3-L4 and postL5. (C–C') A dividing cell with its unit nematic depicting the division orientation. Scale bar 10 microns. (D) Coarse-grained pattern of cell division orientation (grid size of 33x33 microns). Scale bar 50 microns.

