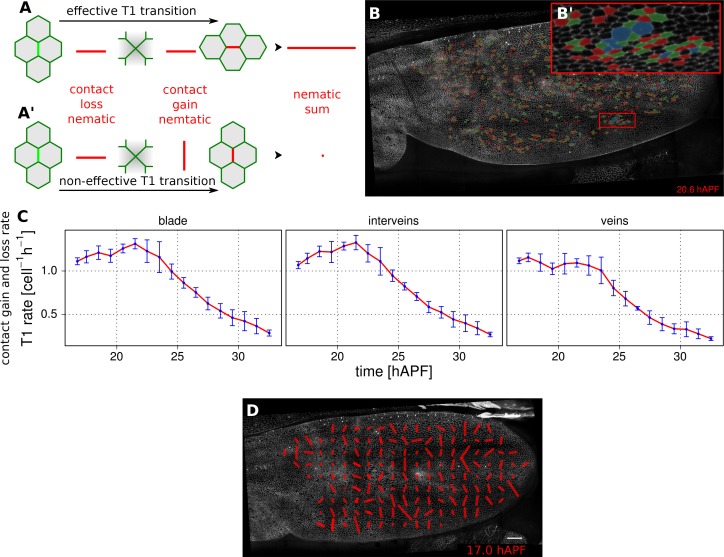
Figure 4. Visualization and quantification of T1 transitions.
(A–A') Cartoon depicting an effective T1 transition (A) that corresponds to cell-contact loss and gain in different directions. Each contact loss or gain is assigned a unit nematic describing its orientation. (B–B') Pattern of cells losing contact (green), gaining contact (red) or both (blue). (C) Rate of neighbor change per cell and per hour in the blade, veins and inter-vein regions of interests. Rates were averaged within discrete time intervals of one hour and further averaged among the 3 WT wings (TM R-User Manual, section 3.8). Error bars depict the standard deviation amongst wings. (D) Coarse-grained pattern of neighbor exchange orientation at 17 hAPF. Cell neighbor change nematics were obtained by summing up unit nematics in each grid elements of 33x33 microns and further averaged in time using a 50 min time window. Scale bar 50 microns.


