. 2016 May 26;5:e14334. doi: 10.7554/eLife.14334

Figure 5. Visualization and quantification of anisotropic cell and tissue deformation.

(A) Triangulation of the cell network: each triangle vertex corresponds to a cell center. (BB') Cartons depicting triangle pure shear and total tissue shear along the x axis. (C) Cartons depicting shear due to T1 transition, cell division and extrusion. (D) Pattern of local tissue shear rate obtained from the triangulation method. Scale bar 50 microns. (E) shows the average rate of tissue shear (blue) in the blade, interveins and veins, and the corresponding cellular shear contributions (other colors). Shaded regions indicate the standard deviation amongst wings. (F) shows the accumulated tissue shear over time and the accumulated contributions of each type of cellular event. The tissue shear (blue) in veins is orientated along the PD axis and it is higher than in inter-vein regions during most of pupal morphogenesis. It leads to an extension along the PD axis and to a narrowing along the anterior-posterior (AP) direction. By the end of the movie, accumulated tissue shear (blue) is almost twice as high in veins as in inter-vein regions. Shaded regions represent the standard deviation amongst wings.

DOI: http://dx.doi.org/10.7554/eLife.14334.021

Figure 5.

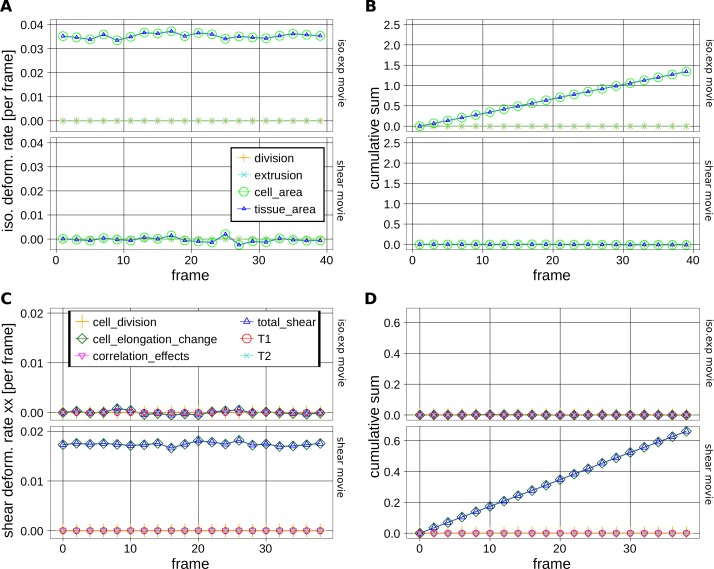
Figure 5—figure supplement 1. Measurements of cell and tissue deformation from two computer-generated sheets of hexagonal cells.

Figure 5—figure supplement 1.

(AD) One dataset corresponds to hexagonal cells undergoing a constant isotropic expansion rate of 3.50 10–2 per frame, and the other corresponds to hexagonal cells undergoing constant pure shear rate of 1.75 10–2 per frame. These datasets are termed iso.exp movie and shear movie respectively in graphs. There isn't any topological change. To keep consistent sets of cells in time, we filtered out cells that become in contact to the image border. We then performed our measurement on these tracked regions of about 50 cells in the shear movie and about 100 cells in the iso.exp movie. (A) Relative tissue area changes (blue) and its decomposition into cell area changes (green), cell number increase by divisions (orange) and cell number descrease by extrusions (cyan). Their corresponding cumulative sums are shown in (B). (C) shows the average tissue shear (blue) and its decomposition into cellular shear contributions (other colors). Their corresponding cumulative sums are shown in (D).
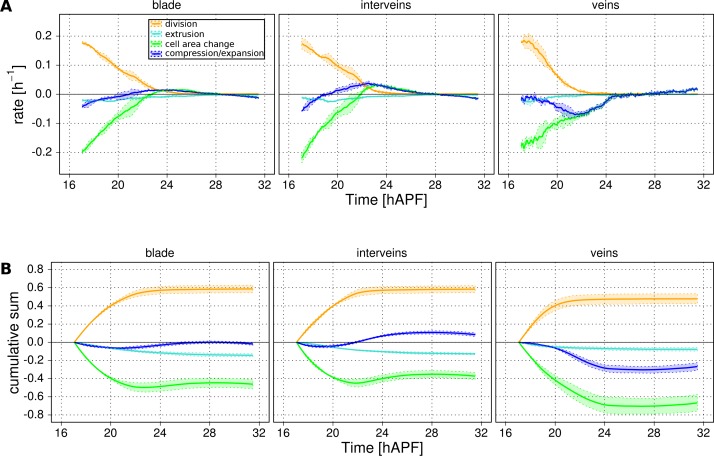
Figure 5—figure supplement 2. Tissue isotropic deformation and cellular contributions in different regions.

Figure 5—figure supplement 2.

(A) Relative rates of tissue area changes (blue) averaged over 3 WT wings for the blade, veins and interveins, and its decomposition into cell area changes (green), cell number increase by divisions (orange) and cell number descrease by extrusions (cyan). Their corresponding cumulative sums are shown in (B). (B) Cumulative tissue area changes and its cellular contributions. Shaded regions represent the standard deviation amongst wings.
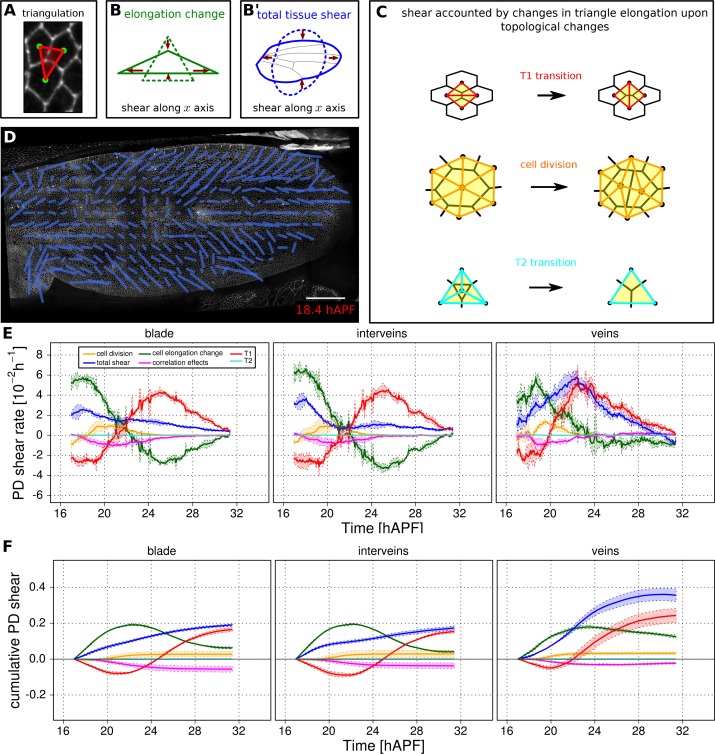
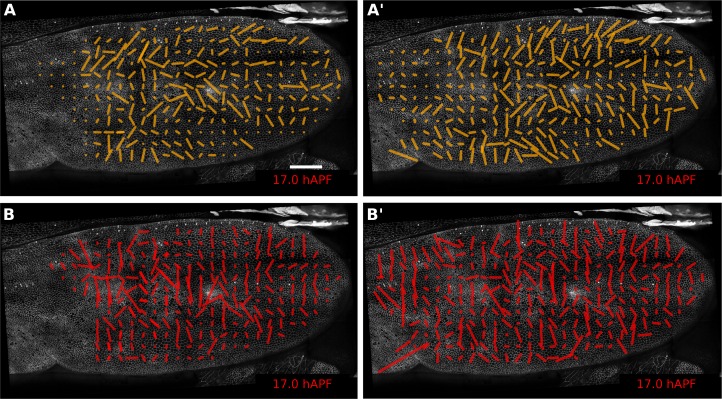
Figure 5—figure supplement 3. Comparison of patterns of cell event orientation with their correponding quantitative patterns of shear.

Figure 5—figure supplement 3.

(A–A') Coarse-grained patterns of cell division orientation (A) and of shear contributed by cell division (A'). The pattern shown in (A) was obtained by summing up cell division nematics in each grid element and by further averaging in time. The pattern shown in (A') was obtained by averaging the shear nematics in each grid element and by further averaging in time. (B–B') Coarse-grained patterns of neighbor-change orientation (B) and of shear contributed by neighbor changes (B'). These patterns were obtained similarly as for cell divisions. Only the shear patterns (A' and B') obtained with the triangulation method provide a quantitative measurement of the local deformation induced by each type of cellular event. Square-grid size of 26x26 microns. Time averaging covering about 55 min (11 frames) in each grid element. Scale bar 50 microns.