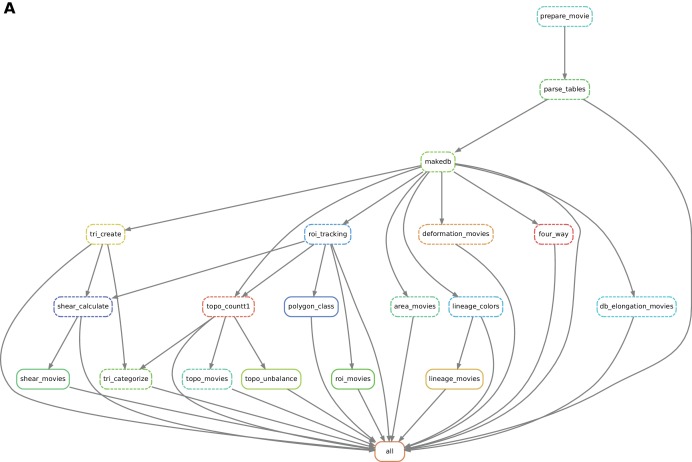
Figure 7. Automated workflow using snakemake.
(A) The snakemake engine can generate a directed acyclic graph (DAG) where we show an example here. This graph represents both the execution dependency (grey arrows) and the execution state of the workflow (solid or dashed line). Each box corresponds to an execution rule, namely a program to be run along with required input(s) and expected output(s). This DAG can be generated at any time when running the workflow (see documentation). Solid lines indicate the rules that have not been executed yet, whereas dashed lines depict completed jobs. The first rule to be executed is called 'prepare_movie': it prepares the tracked images from TissueAnalyzer to be converted by the parser into tables of values containing all necessary entities along with their properties ('parse_tables' rule). Then the 'make_db' rule is executed for building the database. Following the grey arrows can one navigate into the next steps of the workflow. The 'roi_tracking' rule filters out cells in contact to margin cells including user-defined regions of interest, and the 'roi_movie' rule allows us to visualize regions of interest over time. The 'deformation_movies' and 'db_elongation_movies' rules generate annotated movies to visualize the deformation of the tissue and the cell state properties (area, elongation). The 'four_way' rule detects four-way vertices and performs basic statistics on vertices. The 'tri_create' rule performs the triangulation of the network for further shear calculation and visualization ('shear_calculate' and 'shear_movies'). It also enables triangle tracking and mapping to each type of cell event ('tri_categorize'). The 'topo_countT1' rule detects neighbor changes that are not due to division or extrusion, and categorizes them into gained or lost neighbors. The 'topo_movies' rule allows one to visualize the coarse-grained rates of division and neighbor changes on the tissue. The 'topo_unbalance' rule is a quality check to verify that the number of gained neighbors is similar to the number of lost neighbors. The 'polygon_class' rule performs the cell-neighbor number count. The 'lineage_colors' rule allows us to optimize the color of each lineage group such that adjacent lineage groups always have different colors. Finally, the 'lineage_movies' rule allows one to visualize lineage groups and cell generations on the tissue. The rule 'all' checks that all upstream jobs have been completed.

