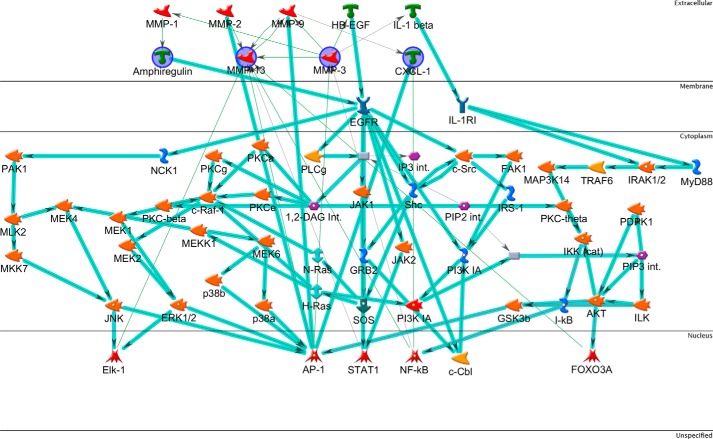
FIGURE 3.
Network analysis of overlap gene list. The list includes genes up-regulated by sublytic MAC at both time points. The network was generated in MetaCore using the following options: shortest path network-building algorithm with a maximum of two steps, inclusive of canonical pathway; this latter option allows sequences of interactions that occur frequently in the cell to be counted as single steps in the shortest path. The network describes the interconnected regulation of up-regulated genes and highlights four key downstream effector genes. The network is organized so that nodes are organized by the subcellular localization of their products, from extracellular to nuclear. Nodes present in the input list are in blue circles. Thick light blue lines highlight the various canonical pathways of signal transduction and transcription regulation. Seed nodes are circled in navy blue, lines represent interactions, either transcriptional regulation or protein-protein associations; red = inhibition and green = activation.

