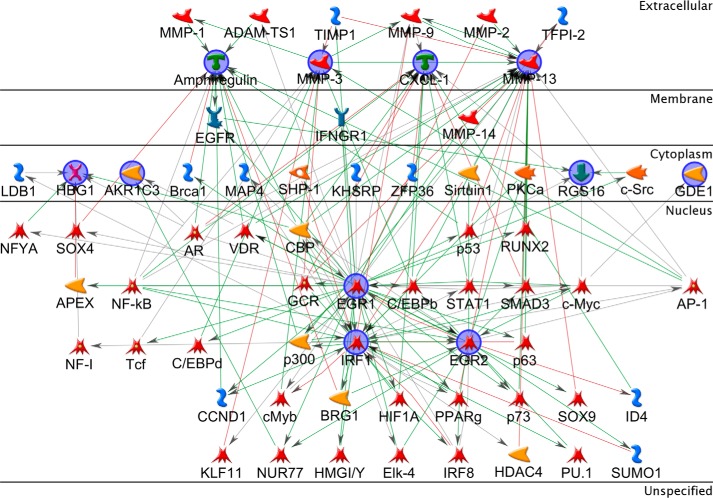
FIGURE 6.
Network analysis of collated gene list. Network describing the interconnected regulation of the four key downstream effector genes as well as the eight statistically significant genes. The network was generated in MetaCore using the following options: shortest path network building algorithm with a maximum of two steps, excluding canonical pathways. The network is organized to show cellular localization from extracellular (top) to nucleus (bottom). From the list, ITPRIP, FAM110C, and HBB-BH1 are not represented on the network due to lack of connectivity. Seed nodes are circled in navy blue, and lines represent interactions either transcriptional regulation or protein-protein associations; red = inhibition, and green = activation.

