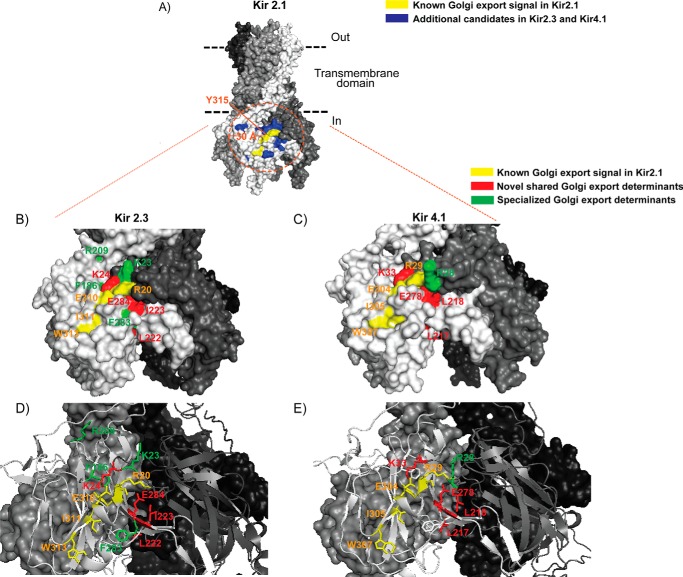
FIGURE 5.
The Golgi export signal patch in Kir2.3 and Kir4.1. A, surface representation of a Kir2.1 tetramer model. Tyr315 is marked (orange) to show the center of the Golgi export signal patch in Kir2.1. Yellow, known surface-exposed residues in the Golgi export signal patch of Kir2.1; blue, additional candidates with a surface-exposed side chain for Golgi export sequence determinants (∼30-Å radius). B and C, surface representation of the entire cytoplasmic domain of Kir2.3 and Kir4.1 tetramer models. D and E, ribbon display of two subunits against a surface rendering of the other two subunits for Kir2.3 and Kir4.1. Relevant residues are color-coded.

