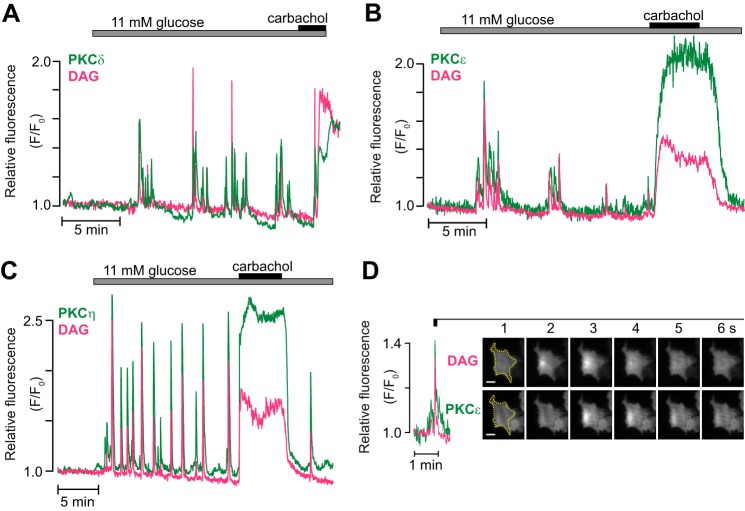
FIGURE 2.
Glucose- and carbachol-induced translocation of nPKCs. Representative TIRF microscopy recordings from single MIN6-cells co-expressing the DAG biosensor (magenta) and GFP-labeled PKC (green) during stimulation with an increase in glucose concentration from 3 to 11 mm, followed by addition of 100 μm carbachol. A–C, DAG dynamics and translocation of PKCδ (A, n = 7 cells in three experiments), PKCϵ (B, n = 8 cells in four experiments), and PKCη (C, n = 9 cells in three experiments). D, TIRF image pairs acquired every second showing the spatial distribution of a DAG spike and corresponding PKCϵ translocation. The cell border is outlined in yellow. The DAG spike occurs in a restricted part of the plasma membrane, and PKCϵ translocates to the same region. Scale bars = 5 μm.

