FIGURE 5.
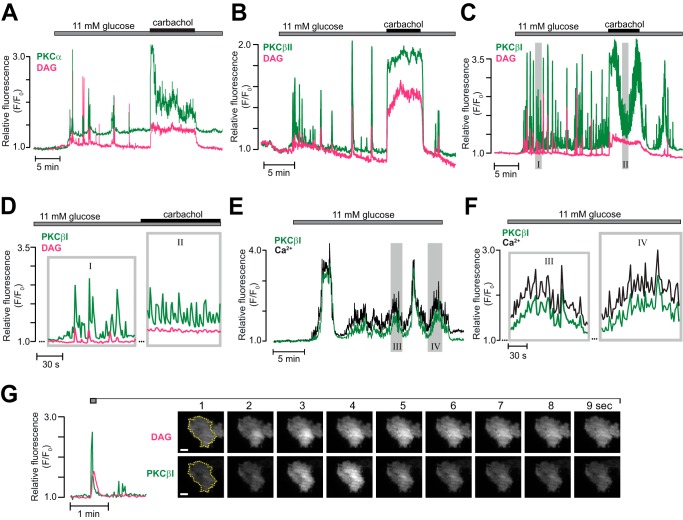
Glucose- and carbachol-induced translocation of cPKC isoforms. A–C, simultaneous TIRF recordings of DAG (magenta) and GFP-tagged PKC (green) of the α (A, n = 8 cells from three experiments), βII (B, n = 6 cells from two experiments), or βI (C, n = 29 cells from five experiments) isoforms in MIN6 cells stimulated by an increase in glucose concentration from 3 to 11 mm followed by addition of 100 μm carbachol. The regions highlighted by shaded rectangles are shown on an expanded time basis in D. D, time expansions of the recording from C. E, slow and fast oscillations of [Ca2+]pm and concomitant PKCβI translocation during a step increase in glucose concentration from 3 to 11 mm (representative of seven of 14 cells in six experiments). The regions highlighted by shaded rectangles are shown on an expanded time basis in F. F, time expansions of the recording from E showing fast oscillations of PKCβI translocation and [Ca2+]pm superimposed on slower ones. G, TIRF intensity recording and corresponding image pairs from the period indicated in the graph. The images were acquired every second and show that the DAG spike occurs in a restricted part of the plasma membrane and that PKCβI translocates to the same region. Scale bars = 5 μm.

