
FIGURE 7.
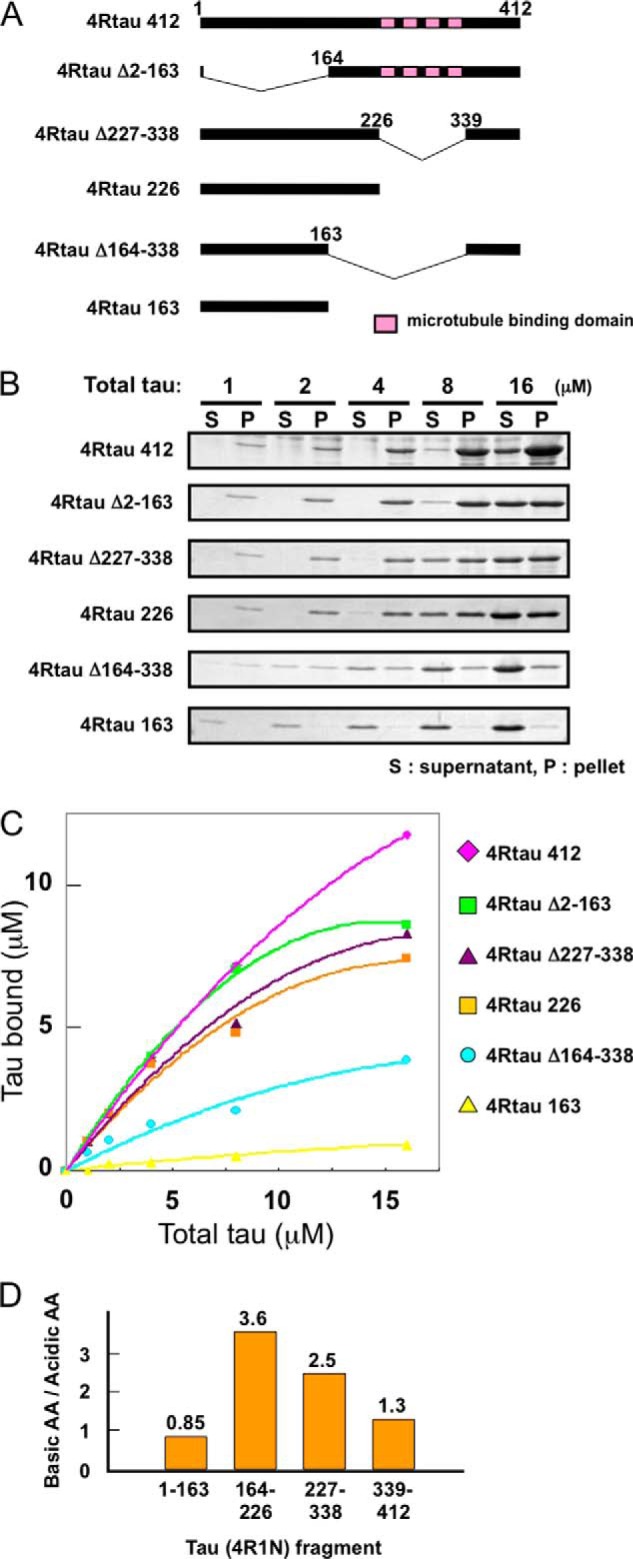
Analysis of the binding region of Tau to α-synuclein fibrils. A, schematic diagram of full-length 4-repeat Tau and the deletion constructs used in this study. Pink boxed regions represent microtubule binding repeats. B, Tau binding to α-synuclein fibrils was analyzed by the spin-down technique. 25 μm α-synuclein fibrils were mixed with various concentrations of wild-type or truncated Tau (final concentration of Tau is given in micromolars). After centrifugation, Tau bound to α-synuclein fibrils (recovered in the pellet) and Tau unbound to fibrils (recovered in supernatant) were analyzed by SDS-PAGE. C, amount of Tau bound to α-synuclein fibrils in each reaction was measured by densitometry and plotted versus total Tau used in each reaction. D, relative ratio of the number of basic amino acids (such as lysine) to that of acidic amino acids (such as glutamic acid) in Tau fragments (1–163, 164–226, 227–338, and 339–412) are shown.