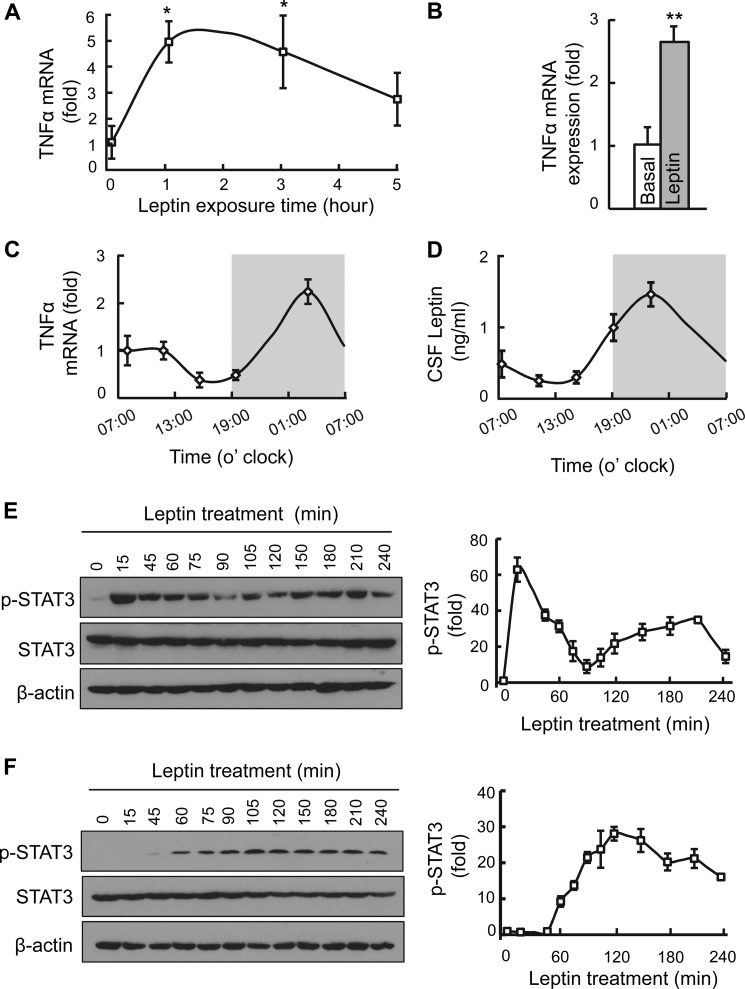
FIGURE 1.
Leptin-induced hypothalamic TNFα production in vitro and in vivo. A, time-dependent change of TNFα mRNA levels in HEK293LEPR cells in response to leptin (10 ng/ml) incubation over 5 h. B, normal adult C57BL/6 mice (chow-fed males) after overnight fasting were treated with leptin (2.5 μg) or vehicle into the third ventricle, and hypothalami were collected 2 h later for measuring TNFα mRNA levels. C and D, circadian patterns of hypothalamic TNFα mRNA levels (C) and CSF leptin concentrations (D). White area represents daytime phase (07:00–19:00), and gray area represents nighttime phase (19:00–7:00). E and F, STAT3 phosphorylation (p-STAT3) levels in HEK293LEPR cells in response to leptin exposure. Cells were deprived of serum for an overnight period and were treated with leptin at a standard dose (100 ng/ml, E) or a low dose (10 ng/ml, F) and analyzed for p-STAT3 levels at the indicated time points. Western blot analysis represented in E and F was quantified and presented in graphs on the right. Each bar graph reflects at least three independent experiments. Error bars reflect mean ± S.E. *, p < 0.05; **, p < 0.01; n = 5–6 samples per group (A), n = 4–6 mice per group (B–D), and n = 3 samples per time point (E, F right). Error bars reflect mean ± S.E.

