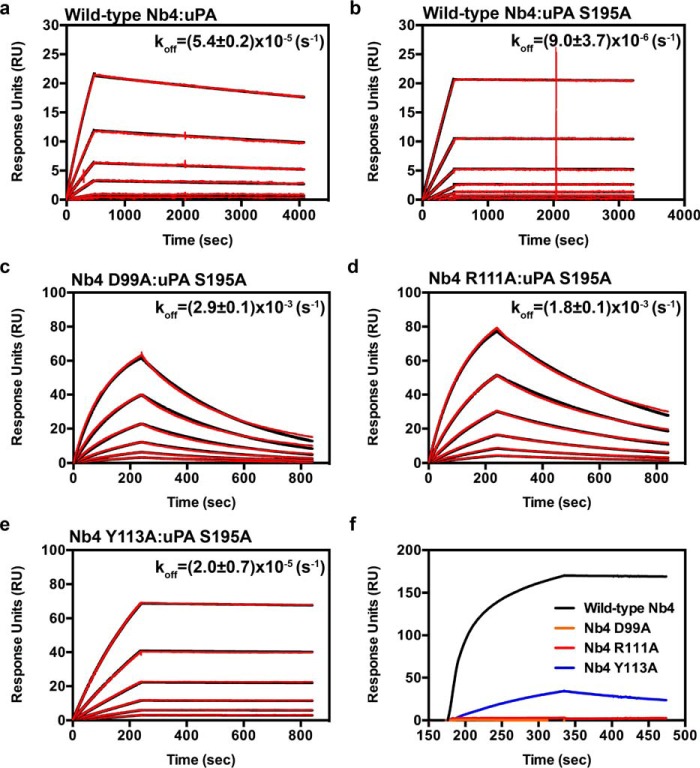
FIGURE 6.
Surface plasmon resonance sensorgrams. Determination of kinetics of binding of wild-type Nb4 to active uPA (a) and wild-type Nb4 (b), Nb4 D99A (c), Nb4 R111A (d), and Nb4 Y113A (e) to catalytically inactive uPA S195A. The experimental data (red curves) were fitted to a 1:1 binding model (black curves) by the BIAcore evaluation software. Sensorgrams are representative of three experiments, and the dissociation rate (koff) is indicated above the curves. f, SPR sensorgram for the binding of wild-type Nb4 (black), Nb4 D99A (orange), Nb4 R111A (red), and Nb4 Y113A (blue) to active uPA.

