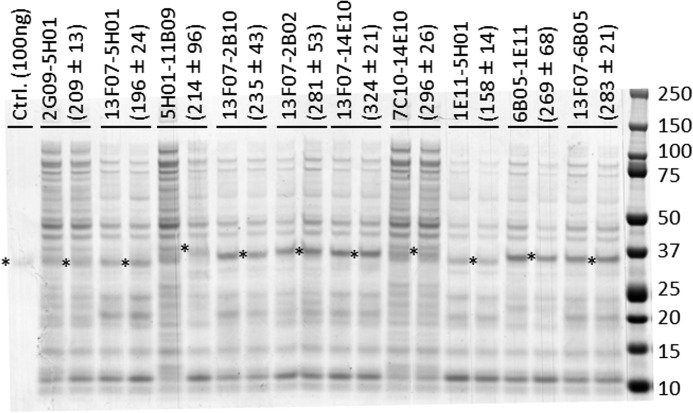
FIGURE 5.
Expression comparison of selected biparatopic Nanobody library clones. Shown is a Coomassie-stained non-reduced SDS-polyacrylamide gel loaded per lane with 10 μl of undiluted crude periplasmic extract from 10 different library clones in duplicate (each representing an independent expression culture started from different single colony). Biparatopic Nanobody bands with molecular masses ranging from 31.5 to 33.3 kDa are marked by an asterisk. Quantification of the Nanobody bands (mean ± S.D. of the duplicates, expressed in ng) was done relative to the 100-ng control sample in the first lane, using Quantity One 4.6.1 software (Bio-Rad). Protein standard molecular masses are shown on the right in kDa.

