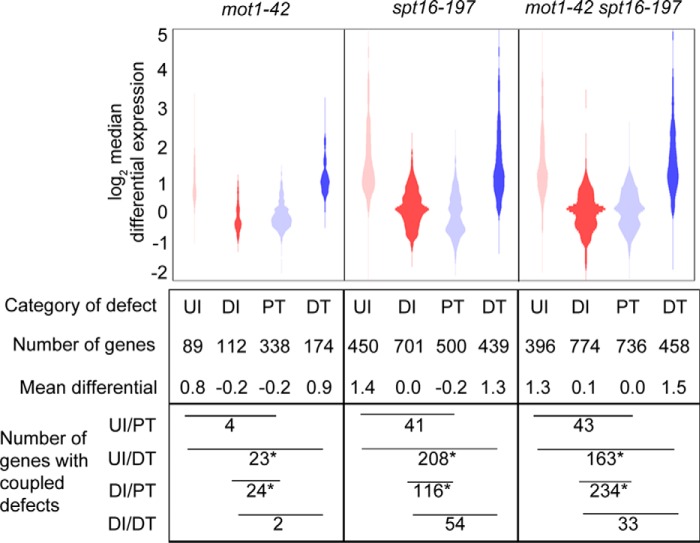
FIGURE 5.
Mot1 and Spt16 have distinct and prominent roles in maintaining transcriptional precision. Distributions of differential expression for each length defect category, UI, DI, PT, and DT, are shown. Plot areas are proportional to the number of genes. Pairs of categories with similar distributions and mean differentials overlap significantly in affected genes. UI and DT co-occurred significantly in all mutants as did DI and PT. Asterisks denote p < 0.001 from a one-tailed Fisher's exact test.

