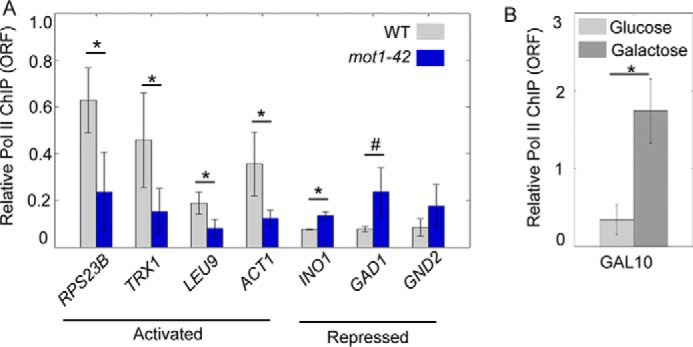
FIGURE 8.

RNA polymerase II levels correlate with expression changes. A, ChIP of Pol II in the open reading frames of the indicated genes was performed using WT (gray) and mot1-42 cells (blue). Error bars indicate one standard deviation of at least three biological replicates. B, ChIP of Pol II in the ORF of GAL10 was performed in WT cells grown in glucose (light gray) and galactose (dark gray). Error bars are standard deviations from two biological replicates. In A and B, the asterisk indicates p < 0.05 from a Student's t test. The # indicates p = 0.055.
