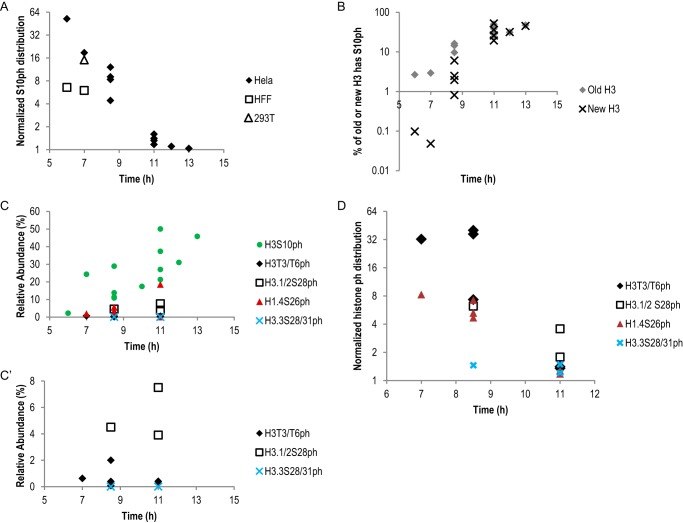
FIGURE 3.
Histone phosphorylation marks were enriched on old histones in early mitosis. A, normalized H3S10ph distribution from three cell types: rhombus, six independent pulse-SILAC experiments with a total of 12 time points from HeLa cells; square, two independent pulse-SILAC experiments from HFF cells; triangle, one pulse-SILAC experiment from 293T cells. Normalized Ser-10 phosphorylation distribution = (S10ph on old H3/S10ph on new H3)/(old H3/new H3). y axis is in log2 scale. B, Ser-10 phosphorylation on new H3 had a lagged phase compared with Ser-10 phosphorylation on old H3. y axis is in log10 scale. C, relative abundance of histone phosphorylation marks in the pulse-SILAC experiments. C, all five phosphorylation marks are shown; C′, three less abundant phosphorylation marks are shown. D, normalized distribution of four additional histone phosphorylation marks. H3T3/T6ph, H3.1/2S28ph, and H1.4S26ph were enriched on old histones in early mitosis and became more symmetric in late mitosis, very similar to the distribution pattern of H3S10ph as shown in A. In contrast, distribution of H3.3S28/31ph was symmetric throughout mitosis. B–D, data for H3S10ph were from the same HeLa experiments shown in A. The data for H3T3/T6ph and H1.4S26ph were from four independent HeLa experiments with a total of six time points. The data for H3.1/2S28ph and H3.3S28/S31ph were from two experiments with three time points. H3.3S28/31ph was only detected in TiO2-enriched samples but not in input samples. Therefore the relative abundance was set to be 0% in C.

