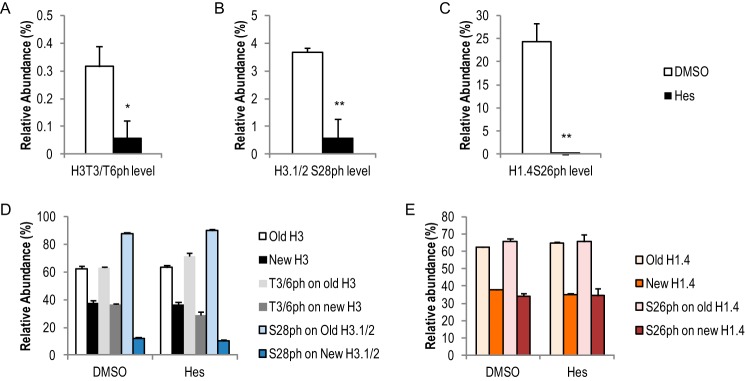
FIGURE 7.
Hesperadin treatments reduced histone phosphorylation levels but did not impact their distribution patterns. Hes treatments reduced H3T3/T6ph (A), H3.1/2S28ph (B), and H1.4S26ph (C) levels, but it did not change the asymmetric distribution of these marks. *, p < 0.05; **, p < 0.01. D and E, bar graphs show relative abundance of histone protein SILAC labeling and phosphorylation mark distribution on H3 (D) and H1.4 (E). Error bars show standard error. Data were collected three late mitosis time points (11 h and beyond).

