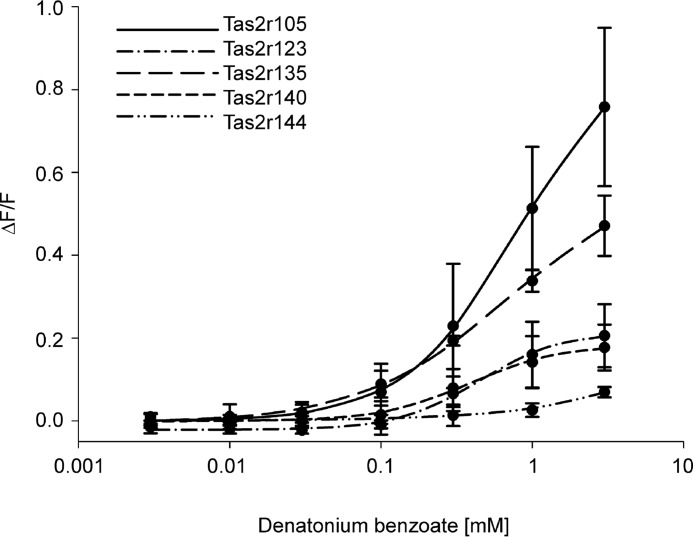
FIGURE 5.
Concentration-response relations for denatonium benzoate in cells expressing Tas2r105, Tas2r123, Tas2r135, Tas2r140, or Tas2r144. The curves have been deduced from calcium traces monitored in FLIPR experiments. Changes in fluorescence (ΔF/F) were plotted semilogarithmically versus agonist concentrations.

