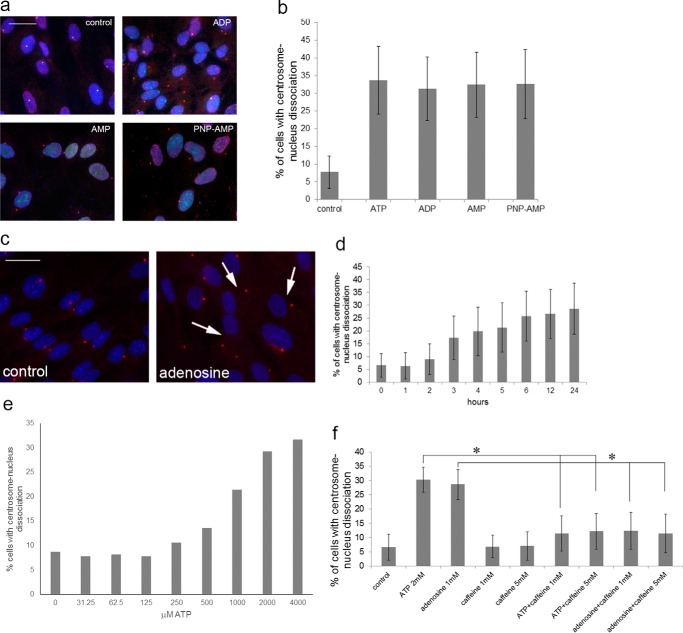
FIGURE 2.
ATP, ADP, AMP, and adenosine induce centrosome-nucleus separation. a, RPE cells were left untreated or treated for 24 h with 2 mm ADP, AMP, or the non-hydrolyzable analog PNP-AMP, fixed, and analyzed as described to visualize the centrosome and nucleus. Control, untreated RPE cells. Scale bar = 20 μm. b, quantitation of the results shown in a. Data were collected from three independent assays, for each of which 300 cells were analyzed. c, RPE cells were treated with 2 mm adenosine for 18 h and analyzed as above. Control, untreated cells. Arrows point to examples of cells with distanced centrosomes and nuclei. Scale bar = 20 μm. d, RPE cells were treated with 2 mm adenosine for the indicated times. Data were collected from three independent assays, for each of which 300 cells were analyzed. e, adenosine dose-response experiment. Data were collected from three independent assays, for each of which 300 cells were analyzed. f, RPE cells were treated with caffeine alone or in combination with ATP or adenosine at the indicated concentrations. Centrosome-nucleus separation was measured as above and quantitated. Data were collected from three independent assays, for each of which 300 cells were analyzed. *, p < 0.05.

