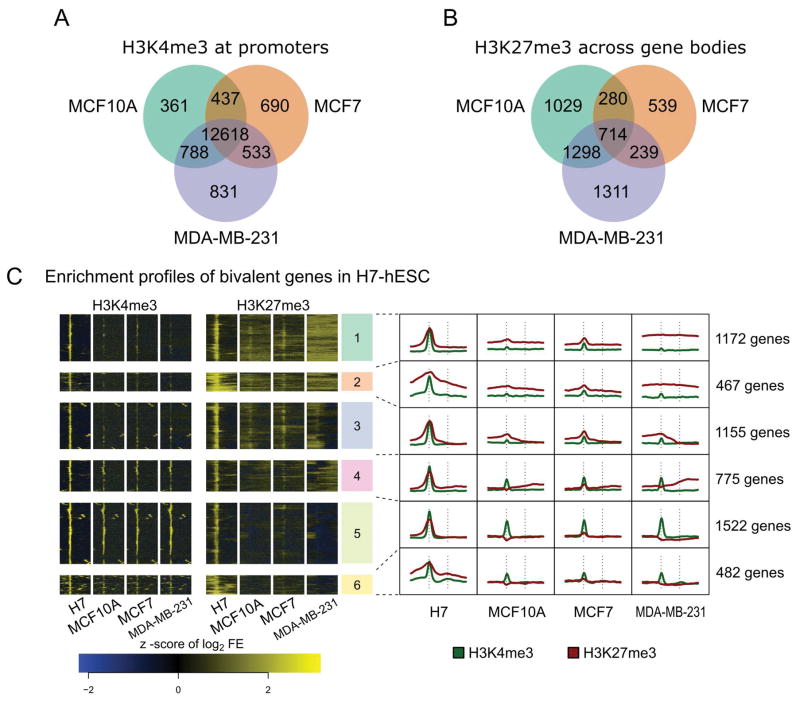
Figure 1. H3K4me3 and H3K27me3 histone modifications in cancer cell lines and compared to H7-hESC bivalently marked genes.
A: The activation associated H3K4me3 mark is largely shared between the MCF10A, MCF7, and MDA-MB-231 breast cell lines. 12,618 genes are marked by H3K4me3 in all three cell lines studied. Fewer than 1000 genes are marked uniquely within any one cell subtype. B: The repression associated H3K27me3 mark on gene bodies shows more variability between the three breast cell subtypes. Only 714 genes are marked in all 3 cell lines. MCF7 cells exhibit the least number of genes uniquely marked, only 539 compared to 1029 in MCF10A and 1311 in MDA-MB-231 cells. C: Clustering of H3K4me3 and H3K27me3 enrichment profiles in hESC and 3 breast cell lines. Six clusters were calculated by k-means clustering. The heatmap on the left presents enrichment profiles for all 5573 genes found to be bivalent in H7-hESC. The line plots on the right summarize each cluster. The TSS and TES of each gene are indicated by vertical dashed lines in the summarization plots. Note the similarity of H3K27me3 near promoters between MCF7 and H7-hESC, and the lack of the same in MDA-MB-231.

