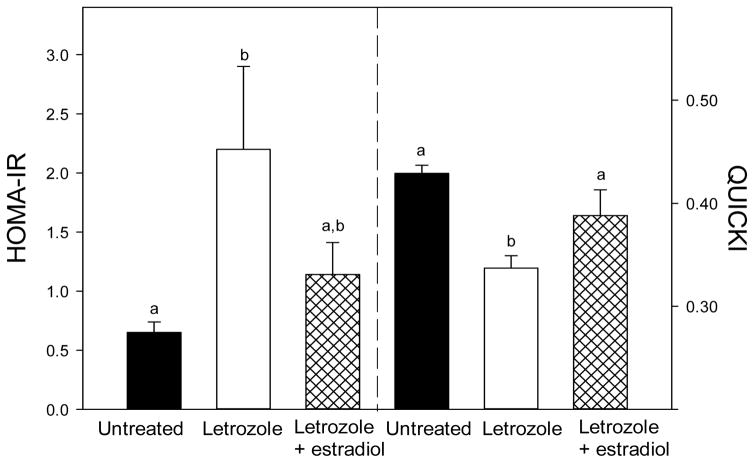
Fig. 5.
(A) HOMA-IR (i.e. basal glucose x basal insulin levels ÷ 405) and (B) QUICKI (i.e. 1/[log (Io) + log (Go)], where Io is the basal insulin and Go the basal glucose levels) for the same baboon offspring in which serum glucose levels are shown in Fig. 3. Values of the bars with different letters are significantly different from each other (P<0.05 for HOMA-IR and P<0.01 for QUICKI, ANOVA, Tukey-Kramer multiple comparison test).

