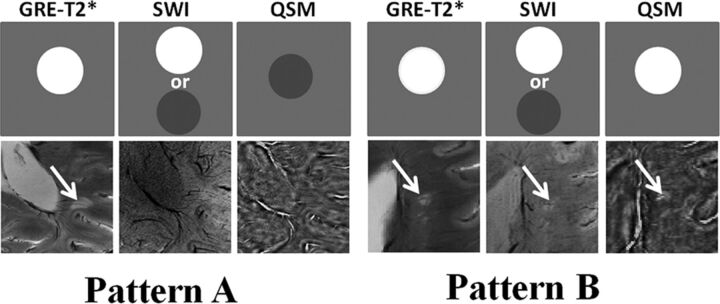
Fig 2.
Non-iron-laden MS lesions (2 differential signal-intensity patterns). In the upper rows, schematic sketches are shown for pattern A and B lesions depicting ideal signal-intensity distribution on the GRE-T2*-weighted image, SWI, and QSM. In the lower rows, axial GRE-T2*-weighted image shows a hyperintense lesion traversed by a central intralesional venule. This lesion is located in close proximity to the posterior horn of the lateral ventricle. However, it appears isointense on SWI and QSM (pattern A) and hence inconspicuous on these images; this feature suggests a chronic inactive stage of lesion development comprising variable degrees of edema, demyelination, micronecrosis, and gliosis. Axial GRE-T2*-weighted image highlights a hyperintense lesion in the periventricular region traversed by a clearly distinguishable central venule. This lesion also appears hyperintense on corresponding SWI and QSM (pattern B), suggesting acute and extensive demyelinating (loss of diamagnetism) and inflammatory processes within the lesion.

