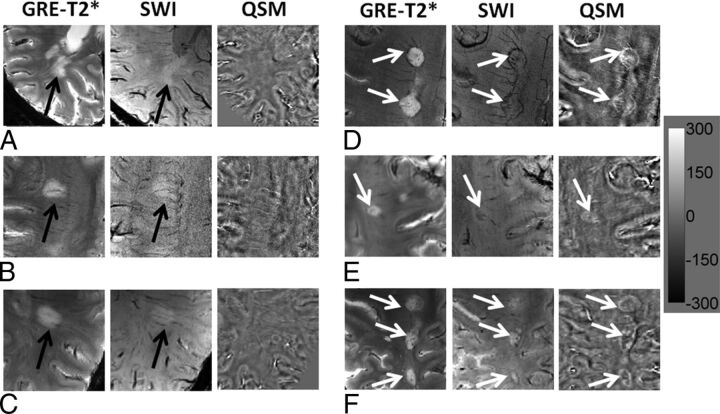
Fig 4.
Large MS lesions with well-defined and ill-defined margins. Axial GRE-T2*-weighted images (A–C) demonstrate large but faint hyperintense lesions (black arrow) without any definite margins. These lesions appear hyperintense on SWI (black arrows) and isointense on QSM; this appearance indicates the absence of iron deposits (left panel). On the other hand, axial GRE-T2*-weighted images (D–F) also show large hyperintense lesions (white arrows) with well-defined margins. These lesions are visible as hypointense structures on SWI and hyperintense on QSM; this appearance is highly suggestive of intralesional iron deposits (right panel). The scale bar is for the QSM image with units of parts per billion.

