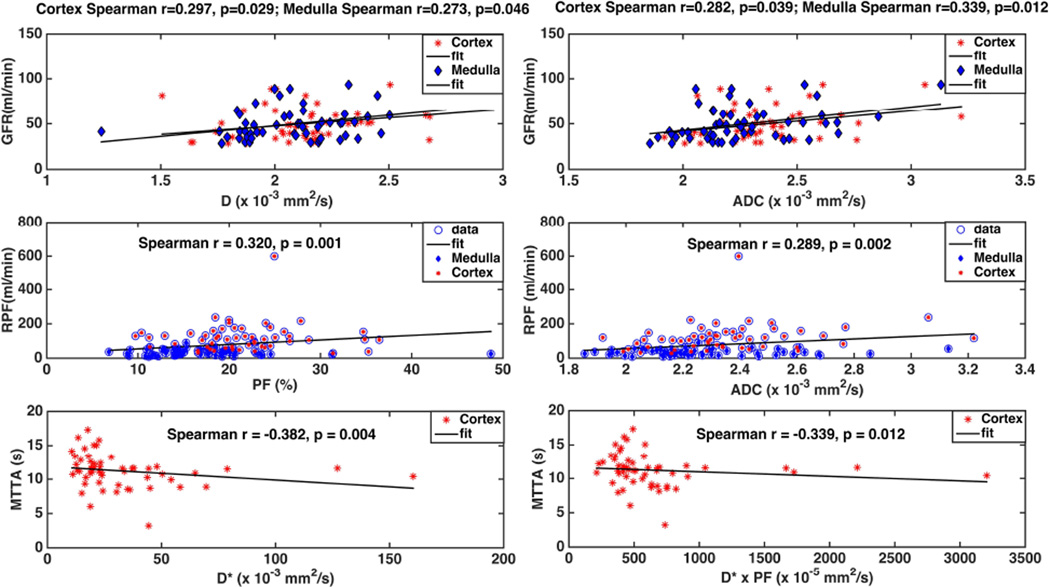
Fig. 5.
Correlation plot of IVIM-DWI metrics with DCE-MRI metrics. DCE-MRI GFR is modestly correlated to D and ADC in the cortex and medulla (top). Perfusion fraction (PF) and apparent diffusion coefficient (ADC) are moderately correlated with renal plasma flow (RPF) for pooled cortical and medullary data (middle). Mean vascular transit time (MTTA) is negatively correlated with the pseudo-diffusion coefficient D* and its product with perfusion fraction, D*× PF (bottom).

