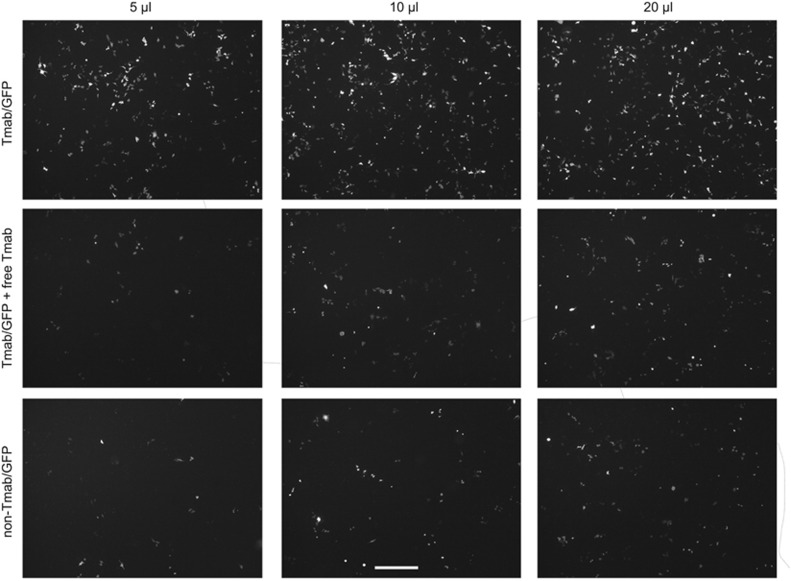
Figure 1.
Green fluorescent protein (GFP) expression in ce2 cells treated with GFP nanocomplexes. Ce2 cells were treated for 3 h with GFP DNA complexes (dosages from 5 to 20 μl) containing Listeriolysin O (LLO) and trastuzumab (Tmab; upper row); containing LLO and Tmab along with free Tmab in the medium as competitor (middle row); or containing LLO without Tmab in the complexes (lower row). Fluorescent cells were visualized 48 h after treatment with an inverted fluorescence microscope, and photographs taken with the 5 × objective. Scale bar, 500 μm.

