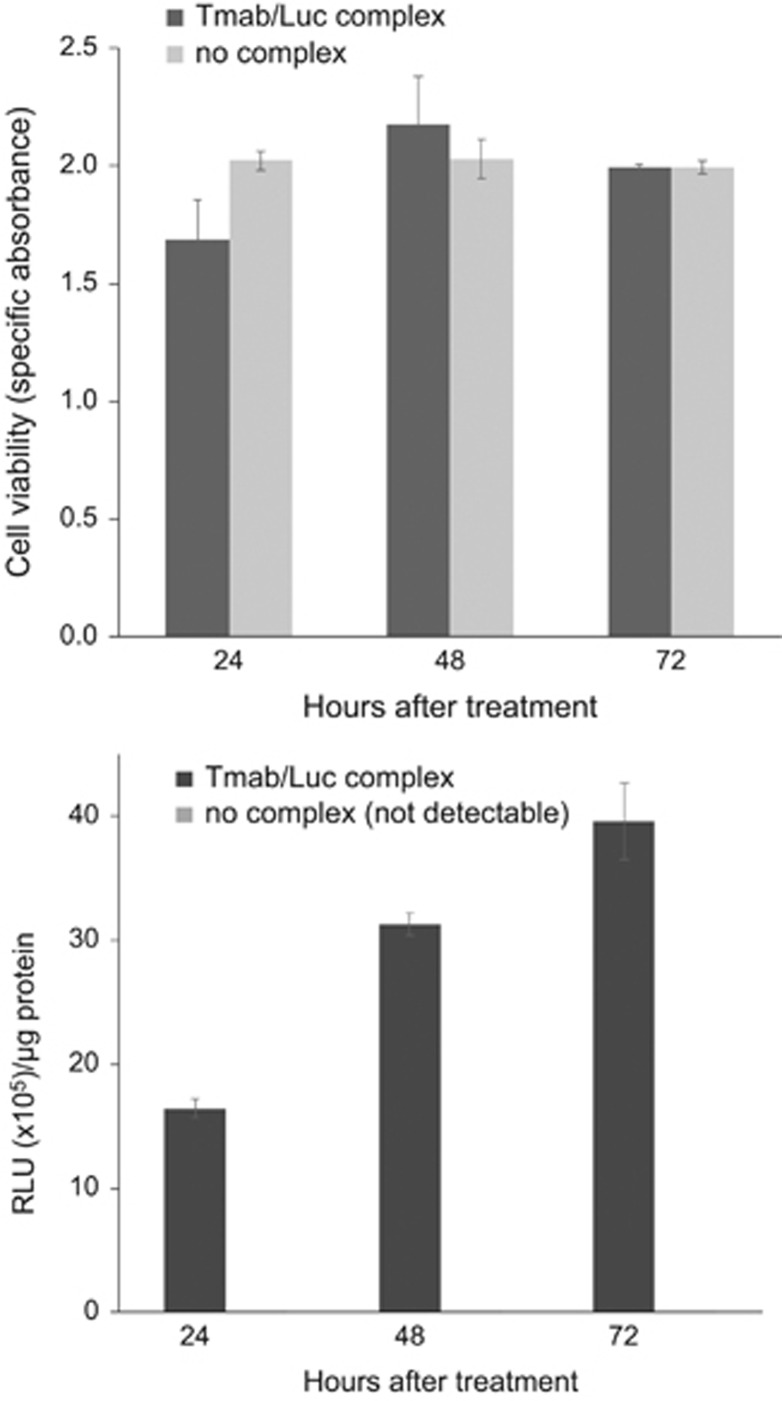
Figure 7.
Effect of trastuzumab/luciferase (Tmab/Luc) complex treatment on cell viability. Charts show XTT viability (upper panel) and luciferase activity (relative light unit (RLU) × 105 units per μg protein, lower panel) of Her18 cells at 24, 48 and 72 h after an initial 3-h treatment with 90 μl medium plus 10 μl per well of Tmab/Luc complex or with 100 μl medium per well as a control (no complex). Bicinchoninic acid (BCA) protein determinations were done on the same cell extracts used for the luciferase assay. The control cells without any complexes had no detectable luciferase activity above the baseline. The data are shown as mean±s.e. (n=3).

